How to Develop an R Shiny Dashboard In 10 Minutes or Less

Developing an R Shiny dashboard from scratch can be a time-consuming process. Luckily for you, you don’t need to start from scratch. In 2021 we released four <a href="https://appsilon.com/shiny-templates-available/" target="_blank" rel="noopener noreferrer">R Shiny dashboard templates</a> that are open to the public. The best part is - you can use and modify them free of charge!
Today we’ll show you how to get started with them. We’ll download the templates from our website, run and customize one of them, and finally, deploy it using <a href="https://www.shinyapps.io/" target="_blank" rel="noopener noreferrer">shinyapps.io</a>. And we'll do it all in under 10 minutes.
<blockquote><strong>Need to integrate a database in your R Shiny apps? <a href="https://appsilon.com/r-shiny-postgres-database/" target="_blank" rel="noopener noreferrer">Check out our detailed guide for Postgres</a>.</strong></blockquote>
Table of contents:
<ul><li><a href="#templates">R Shiny Dashboard Templates from Appsilon</a></li><li><a href="#run-dashboard">How to Run An R Shiny Dashboard</a></li><li><a href="#customize-dashboard">Customize Appsilon's R Shiny Dashboards</a></li><li><a href="#deploy-dashboard">How to Deploy An R Shiny Dashboard</a></li><li><a href="#conclusion">Conclusion</a></li></ul>
<hr />
<h2 id="templates">R Shiny Dashboard Templates from Appsilon</h2>
At Appsilon, we’re constantly looking for ways to make life easier for data scientists, individual Shiny developers, and small teams who may not be able to engage Appsilon in a full project. We’ve released a number of <a href="https://appsilon.com/opensource/" target="_blank" rel="noopener noreferrer">open-source R packages</a> to help the R community build better R Shiny dashboards.
In September 2021, we decided to take it a step further by releasing a set of four templates you can use and modify per your liking - completely free of charge.
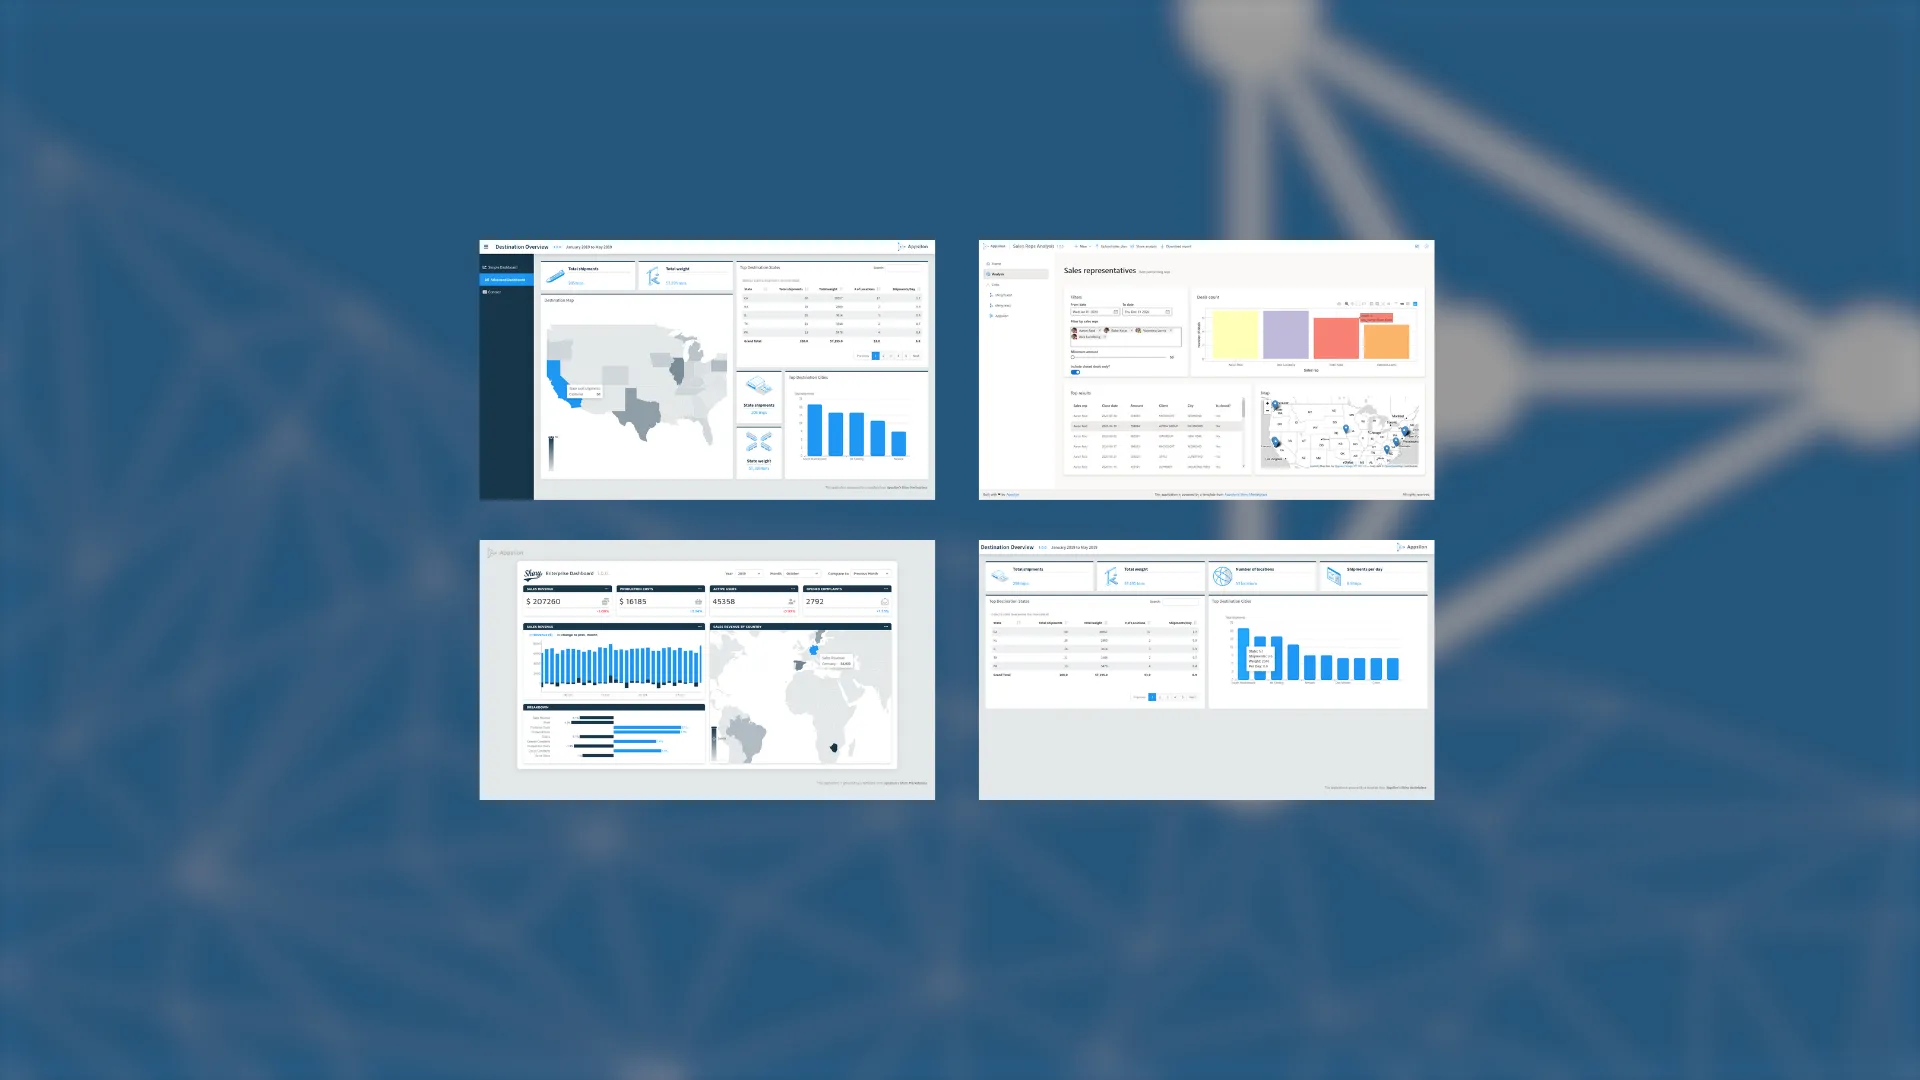
The <a href="https://templates.appsilon.com/" target="_blank" rel="noopener noreferrer">Appsilon Shiny Dashboard Template bundle</a> contains 4 applications. Each Shiny dashboard template is a free, open-source dashboard that users can download, install, and customize within minutes. We aim to help the R community quickly launch new projects or augment existing ones.
The Shiny dashboard templates chosen for the bundle contain elements that are easily transferable to a variety of projects and cover three key features for app development:
<ul><li><strong>Interactivity</strong> – e.g., Enterprise Dashboard & Destination Overview</li><li><strong>UI/UX Design</strong> – e.g., Fluent UI App</li><li><strong>Simplicity</strong> – e.g., Destination Overview & Destination Overview Basic</li></ul>
To get started, simply fill out the form on our <a href="https://templates.appsilon.com/" target="_blank" rel="noopener noreferrer">templates page</a> and download a zip file:
<img class="size-full wp-image-11990" src="https://webflow-prod-assets.s3.amazonaws.com/6525256482c9e9a06c7a9d3c%2F65b01f1cfd01060a37df5b0e_appsilon-shiny-templates-landing-page.webp" alt="Image 1 - Appsilon’s templates page" width="2584" height="1974" /> Image 1 - Appsilon’s Shiny templates page
We’ll see you in the next section where we’ll show you how to restore the R environment and run one dashboard.
<h2 id="run-dashboard">How to Run An R Shiny Dashboard</h2>
We’ll work on the <a href="https://connect.appsilon.com/shiny-enterprise-demo/" target="_blank" rel="noopener noreferrer">Enterprise dashboard</a> throughout the article. Here’s what it looks like on our demo page:
<img class="size-full wp-image-11996" src="https://webflow-prod-assets.s3.amazonaws.com/6525256482c9e9a06c7a9d3c%2F65b01f1e6c7e8f92760a8345_enterprise-dashboard-from-appsilon.webp" alt="Image 2 - Enterprise dashboard from Appsilon" width="2882" height="1982" /> Image 2 - Enterprise dashboard from Appsilon
We assume you’ve downloaded our Shiny templates Zip file and that you have it extracted somewhere locally. The next step is to open the shiny-enterprise-dashboard folder as an RStudio Project:
<img class="size-full wp-image-11998" src="https://webflow-prod-assets.s3.amazonaws.com/6525256482c9e9a06c7a9d3c%2F65b01f1f2ae89d4dce37fdde_enterprise-dashboard-opened-in-rstudio.webp" alt="Image 3 - Enterprise dashboard opened in R Studio" width="2744" height="2084" /> Image 3 - Enterprise dashboard opened in RStudio
It’s likely you don’t have all dependencies we used during development, so that’s where the next step comes in. You’ll have to restore the R environment from the <code>renv</code> folder. It’s easier than it sounds actually, as it boils down to running a single command from the R console:
<script src="https://gist.github.com/darioappsilon/bb804f59a044b37366572bcc762c58b1.js"></script>
It might take a while, as there are plenty of packages that have to be downloaded and installed. Once done, you can open either <code>ui.R</code> or <code>server.R</code> and hit the <em>Run App</em> button - here’s what you will see:
<img class="size-full wp-image-12006" src="https://webflow-prod-assets.s3.amazonaws.com/6525256482c9e9a06c7a9d3c%2F65b01f216bb6e6a6629c1e1c_running-enterprise-dashboard.gif" alt="Image 4 - Running the Enterprise dashboard locally" width="1314" height="840" /> Image 4 - Running the Enterprise dashboard locally
You’re all set to begin customizing the dashboard. Let’s do that in the following section.
<h2 id="customize-dashboard">Customize Appsilon's R Shiny Dashboards</h2>
We’ll do a couple of modifications in this section, both on the UI and Server logic. We’ll start by working on the styles - modifying the text and colors shown on the dashboard.
<h3>Change the styles</h3>
To change the overall blue theme on our R Shiny dashboard, we’ll first have to open the <code>variables.scss</code> configuration file. You can find it under the <em>styles/config/</em> folder. Change the following variables to have the following values:
<script src="https://gist.github.com/darioappsilon/ffac459bfaf572618fecbdc4a291c209.js"></script>
These hex codes represent different shades of green, so the variable names aren’t representative. You can change them if you wish, but we won’t for the purpose of this article.
Next, navigate to <code>modules/breakdown_chart.R</code> and change line 61 to match the following:
<script src="https://gist.github.com/darioappsilon/17f12ea7a0edfea60de13ea3ac25adf2.js"></script>
We’ll have to do something similar in <code>modules/time_chart.R</code>, but this time on lines 82 and 83. Make sure they have the following values for colors:
<script src="https://gist.github.com/darioappsilon/7e877c220ca8585b34da7d3d692efa57.js"></script>
Finally, open <code>constants.R</code> and change the following:
<script src="https://gist.github.com/darioappsilon/b2f02dee65c4fb838653686304eef8e9.js"></script>
And these are all the changes you need to make to make the dashboard green. We’ve also modified some text, so let’s verify everything works. Your dashboard should look like this once you run it:
<img class="size-full wp-image-12004" src="https://webflow-prod-assets.s3.amazonaws.com/6525256482c9e9a06c7a9d3c%2F65b01f21feabe8f16c32af6b_modifying-enterprise-dashboard.gif" alt="Image 5 - Enterprise dashboard after modifying the colors" width="1314" height="840" /> Image 5 - Enterprise dashboard after modifying the colors
It’s definitely a good start, but let’s also see how to change the server logic.
<h3>Change the charts</h3>
We’ll change the bottom <em>Breakdown</em> chart slightly in this section. We’ll go from a horizontal bar chart to a vertical one. To do so, open up <code>modules/breakdown_chart.R</code> and modify the code starting at line 68. We don’t need <code>coord_flip()</code> anymore and we also have to modify the text position.
Here’s the entire code snippet:
<script src="https://gist.github.com/darioappsilon/1cb453e4e8e6759ddf14e054840953ef.js"></script>
Let’s run the dashboard again and see what we’re dealing with:
<img class="size-full wp-image-12002" src="https://webflow-prod-assets.s3.amazonaws.com/6525256482c9e9a06c7a9d3c%2F65b01f2204abfeee1f057f34_modifying-enterprise-dashboard-2.gif" alt="Image 6 - Enterprise dashboard after changing the bar orientation" width="1314" height="840" /> Image 6 - Enterprise dashboard after changing the bar orientation
It’s not a groundbreaking change, but lets you see how easy it is to tweak Appsilon templates, both from the UI and Server perspective.
The <em>Breakdown</em> chart was made with <code>ggplot2</code>. If you're not familiar with ggplot2, read our detailed guides:
<ul><li><a href="https://appsilon.com/ggplot2-bar-charts/" target="_blank" rel="noopener noreferrer">Bar Charts with ggplot2</a></li><li><a href="https://appsilon.com/ggplot2-line-charts/" target="_blank" rel="noopener noreferrer">Line Charts with ggplot2</a></li><li><a href="https://appsilon.com/ggplot-scatter-plots/" target="_blank" rel="noopener noreferrer">Scatter Plots with ggplot2</a></li></ul>
There’s only one thing left to do. Deployment!
<h2 id="deploy-dashboard">How to Deploy R Shiny Dashboards</h2>
We’ll now show you how to deploy your R Shiny Dashboard on <a href="https://www.shinyapps.io/" target="_blank" rel="noopener noreferrer">shinyapps.io</a>. You’ll have to register for a free account first. You can use your Google or GitHub credentials to shorten the process.
Once done, you’ll have to install the <code>rsconnect</code> package from the R console and authenticate through it. You can find authentication details (name, token, and secret key) on the shinyapps dashboard page:
<script src="https://gist.github.com/darioappsilon/be6a6fff20a4df670915cc53eec070af.js"></script>
Almost there! From the R console, import the <code>rsconnect</code> package and call the <code>deployApp()</code> function as shown below:
<script src="https://gist.github.com/darioappsilon/bbfb46fa984468c15e1274b4361bd34e.js"></script>
You should see the following output after a couple of minutes:
<img class="size-full wp-image-11992" src="https://webflow-prod-assets.s3.amazonaws.com/6525256482c9e9a06c7a9d3c%2F65b01f2338e39fcee7550cc2_deploy-to-shinyapps.io_.webp" alt="Image 7 - Deployment to shinyapps.io through R console" width="1580" height="512" /> Image 7 - Deployment to shinyapps.io through R console
The deployed dashboard will open automatically. Here’s what ours looks like:
And that’s how you go from a template to a deployed dashboard in 10 minutes. Let’s wrap things up next.
<img class="size-full wp-image-11994" src="https://webflow-prod-assets.s3.amazonaws.com/6525256482c9e9a06c7a9d3c%2F65b01f24487b2c34e796c963_deployed-enterprise-dashboard.webp" alt="Image 8 - Deployed Enterprise dashboard on shinyapps.io" width="2878" height="2304" /> Image 8 - Deployed Enterprise dashboard on shinyapps.io
<h2 id="conclusion">Conclusion</h2>
You don’t have to be an expert R Shiny developer to make usable dashboards. Our templates can help if you don’t have the time to learn all the little tricks and fine details that make Appsilon a global leader in developing R Shiny dashboards. Plus, they show you exactly how you should structure your code when developing commercial applications.
We’ve only scratched the surface today, so here are a couple of homework assignments you can work on:
<ul><li>Change the <em>Sales Revenue </em>bar chart type from stacked to grouped.</li><li>Add a custom logo instead of Appsilon’s.</li><li>Use a different library to configure the map (<em>Sales Revenue by Country</em>) - possibly <a href="https://appsilon.com/leaflet-geomaps/" target="_blank" rel="noopener noreferrer">Leaflet</a>?</li></ul>
Feel free to share results with us on Twitter – <a href="https://twitter.com/appsilon" target="_blank" rel="noopener noreferrer">@appsilon</a>. We’d love to see what you came up with.
<blockquote><strong>Interested in learning R Shiny further? <a href="https://appsilon.com/how-to-start-a-career-as-an-r-shiny-developer/" target="_blank" rel="noopener noreferrer">Here’s how to start a career as an R Shiny developer</a>.</strong></blockquote>
If you need a PoC fast or an improvement on an existing concept, reach out to us. Appsilon is a global leader in R/Shiny development. And the Appsilon team plays an active role within the R/Shiny community, developing and maintaining open source packages and Shiny templates. From design to infrastructure, our <a href="https://shiny.tools/" target="_blank" rel="noopener noreferrer">Shiny tools</a> can be used to build efficient, <a href="https://appsilon.com/shiny/" target="_blank" rel="noopener noreferrer">beautiful Shiny applications</a> that scale. We’ve got the skillset to solve the most challenging of problems and we're an <a href="https://appsilon.com/appsilon-is-an-rstudio-full-service-certified-partner/" target="_blank" rel="noopener noreferrer">RStudio Full Service Certified Partner</a>.
Check out our latest resources - ebooks, Shiny Gatherings, cheatsheets and more.