Introducing Shiny Assistant - You Can Now Build Shiny Applications with GPT and GenerativeAI


It finally happened.
It’s been almost two years since the first release of ChatGPT. It took the world by storm, to put it mildly. In the short period that followed, we now have multiple companies building Generative AI platforms that were unimaginable before late 2022. What a great time to be a consumer.
Your new sidekick for building Shiny apps - Shiny Assistant - has nothing to do with the company behind ChatGPT, but is wrapped in an interface that’ll feel right at home. It’s built on the Claude 3.5 Sonnet model released by Anthropic, a San Francisco-based AI company.
To be more precise, the Assistant is built on a Large Language Model specialized in Shiny, R, and Python coding, allowing you to create applications, debug, refactor code, and switch between Shiny for R and Python.
How good is Shiny Assistant in the current closed beta stage? Join us on a journey building an entire application to find out.
Is your R Shiny app slow? Consider handling large datasets with DuckDB.
Table of contents:
- What is Shiny Assistant and Why Should You Care?
- Shiny Assistant in Action - Let’s Build an R Shiny Application from Scratch
- Is Shiny Assistant Worth Your Time? Pros and Cons
- Summing up Shiny Assistant
What is Shiny Assistant and Why Should You Care?
Think of Shiny Assistant as your AI companion for building Shiny apps.
It doesn’t matter if you prefer R or Python, as the Assistant can work with both. Just keep in mind that Shiny for Python is about a decade younger than its R equivalent, so the quality and variety of answers might not be at the same level. We’ll test only the R implementation in this article, and leave Python for some other time.
Shiny Assistant is currently in an invite-only closed beta stage:

We encourage you to join the waitlist. As soon as you’re accepted, you’ll see the following screen:
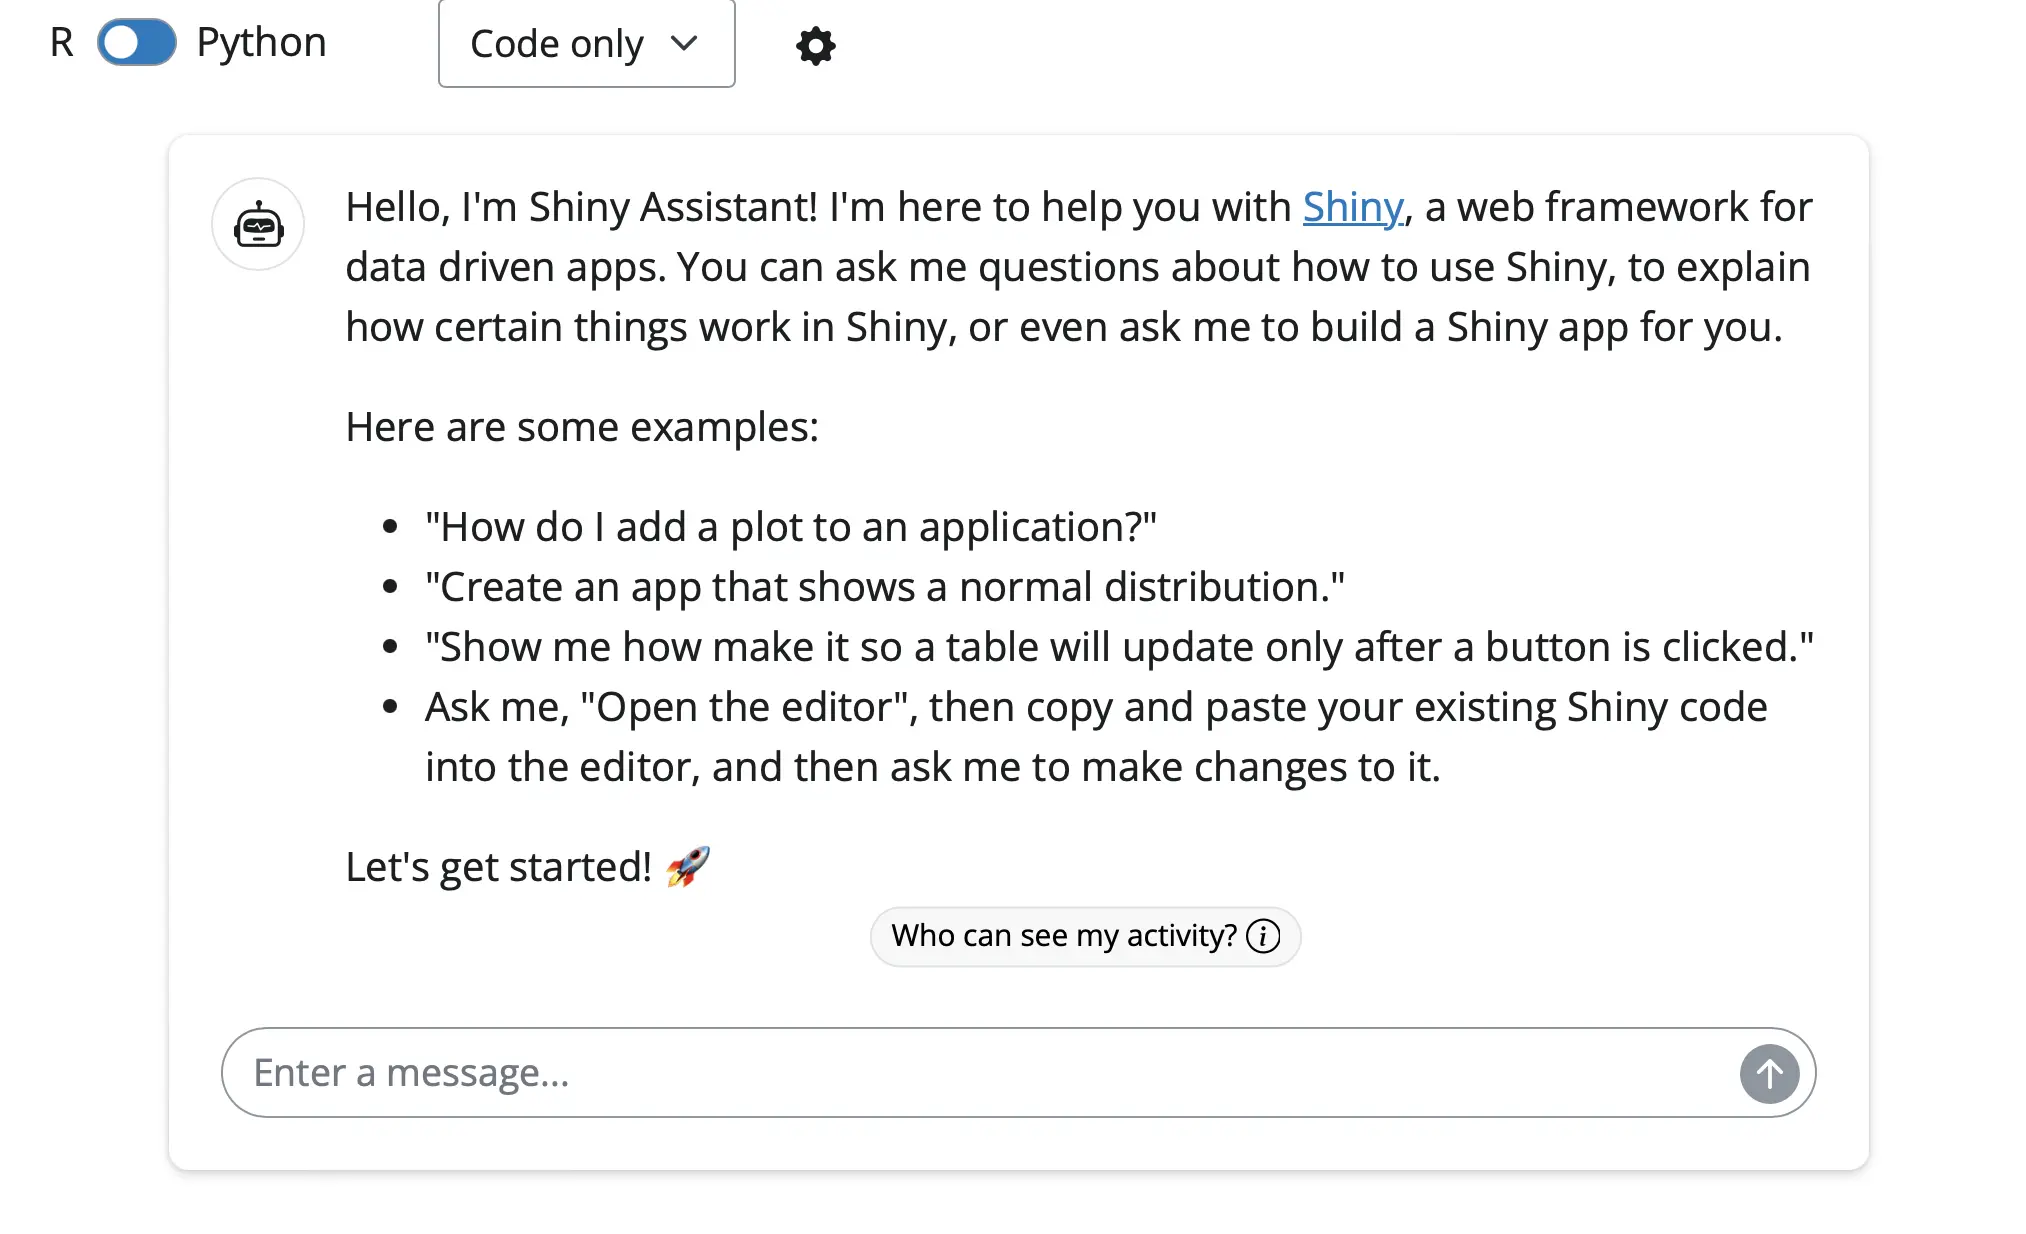
From here, you can start communicating with the chatbot or you can tweak the response type (“Code only”, ”Concise”, or ”Verbose”), but this feature isn’t currently working as expected (more about it later). You can also specify your own API key for Anthropic through the settings menu.
And that’s about it - the starting interface is simple.
It’s when you submit your first message that you’ll see a 3-column screen layout with a chatbot (left), generated code (middle), and live preview (right):
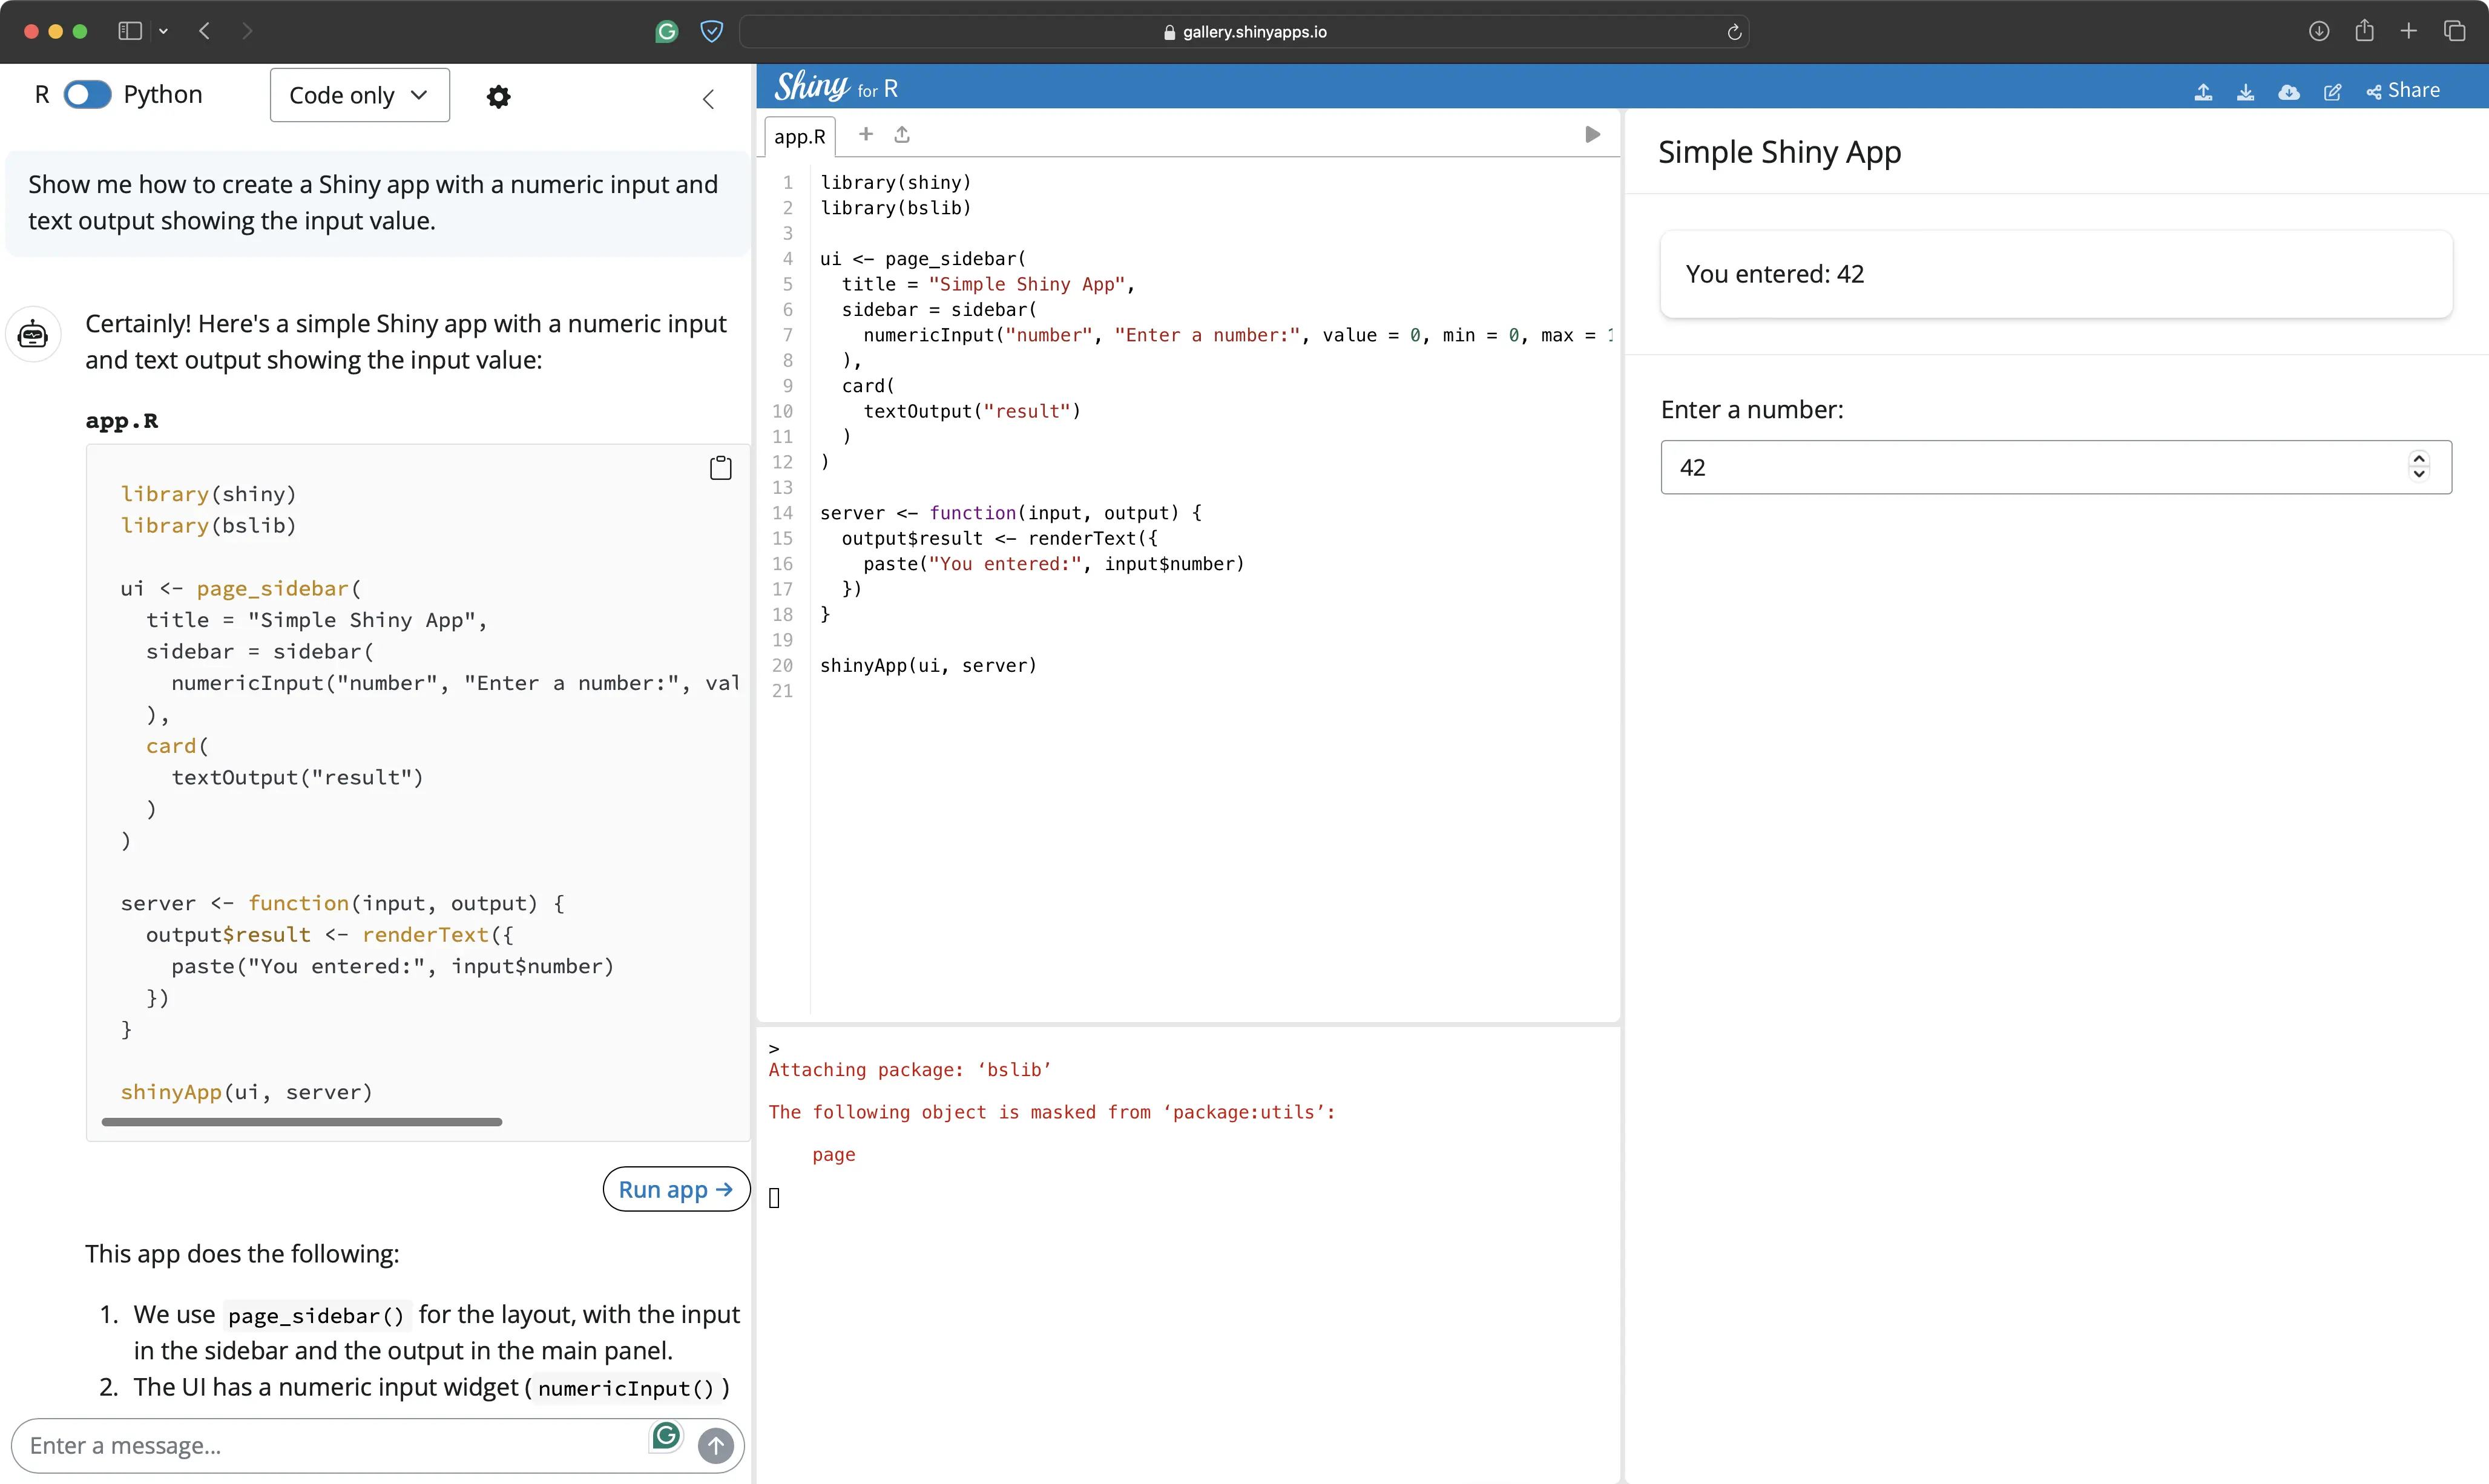
You’ll get really familiar with the UI in the following section, as we’ll use the chatbot to build an entire app from scratch!
Shiny Assistant in Action - Let’s Build an R Shiny Application from Scratch
There are numerous ways to build applications with AI.
It’s hard to argue which one works best, but a logical assumption is that building an app incrementally (prompt by prompt, or component by component) leaves less room for error than if you were to dump every requirement into one massive prompt. The component-based approach might still fail, but spotting and fixing errors is much faster since you’re working on one thing at a time.
For that reason, we’ll first give the Shiny Assistant a chance to get familiar with the data and project requirements and then build the app piece by piece.
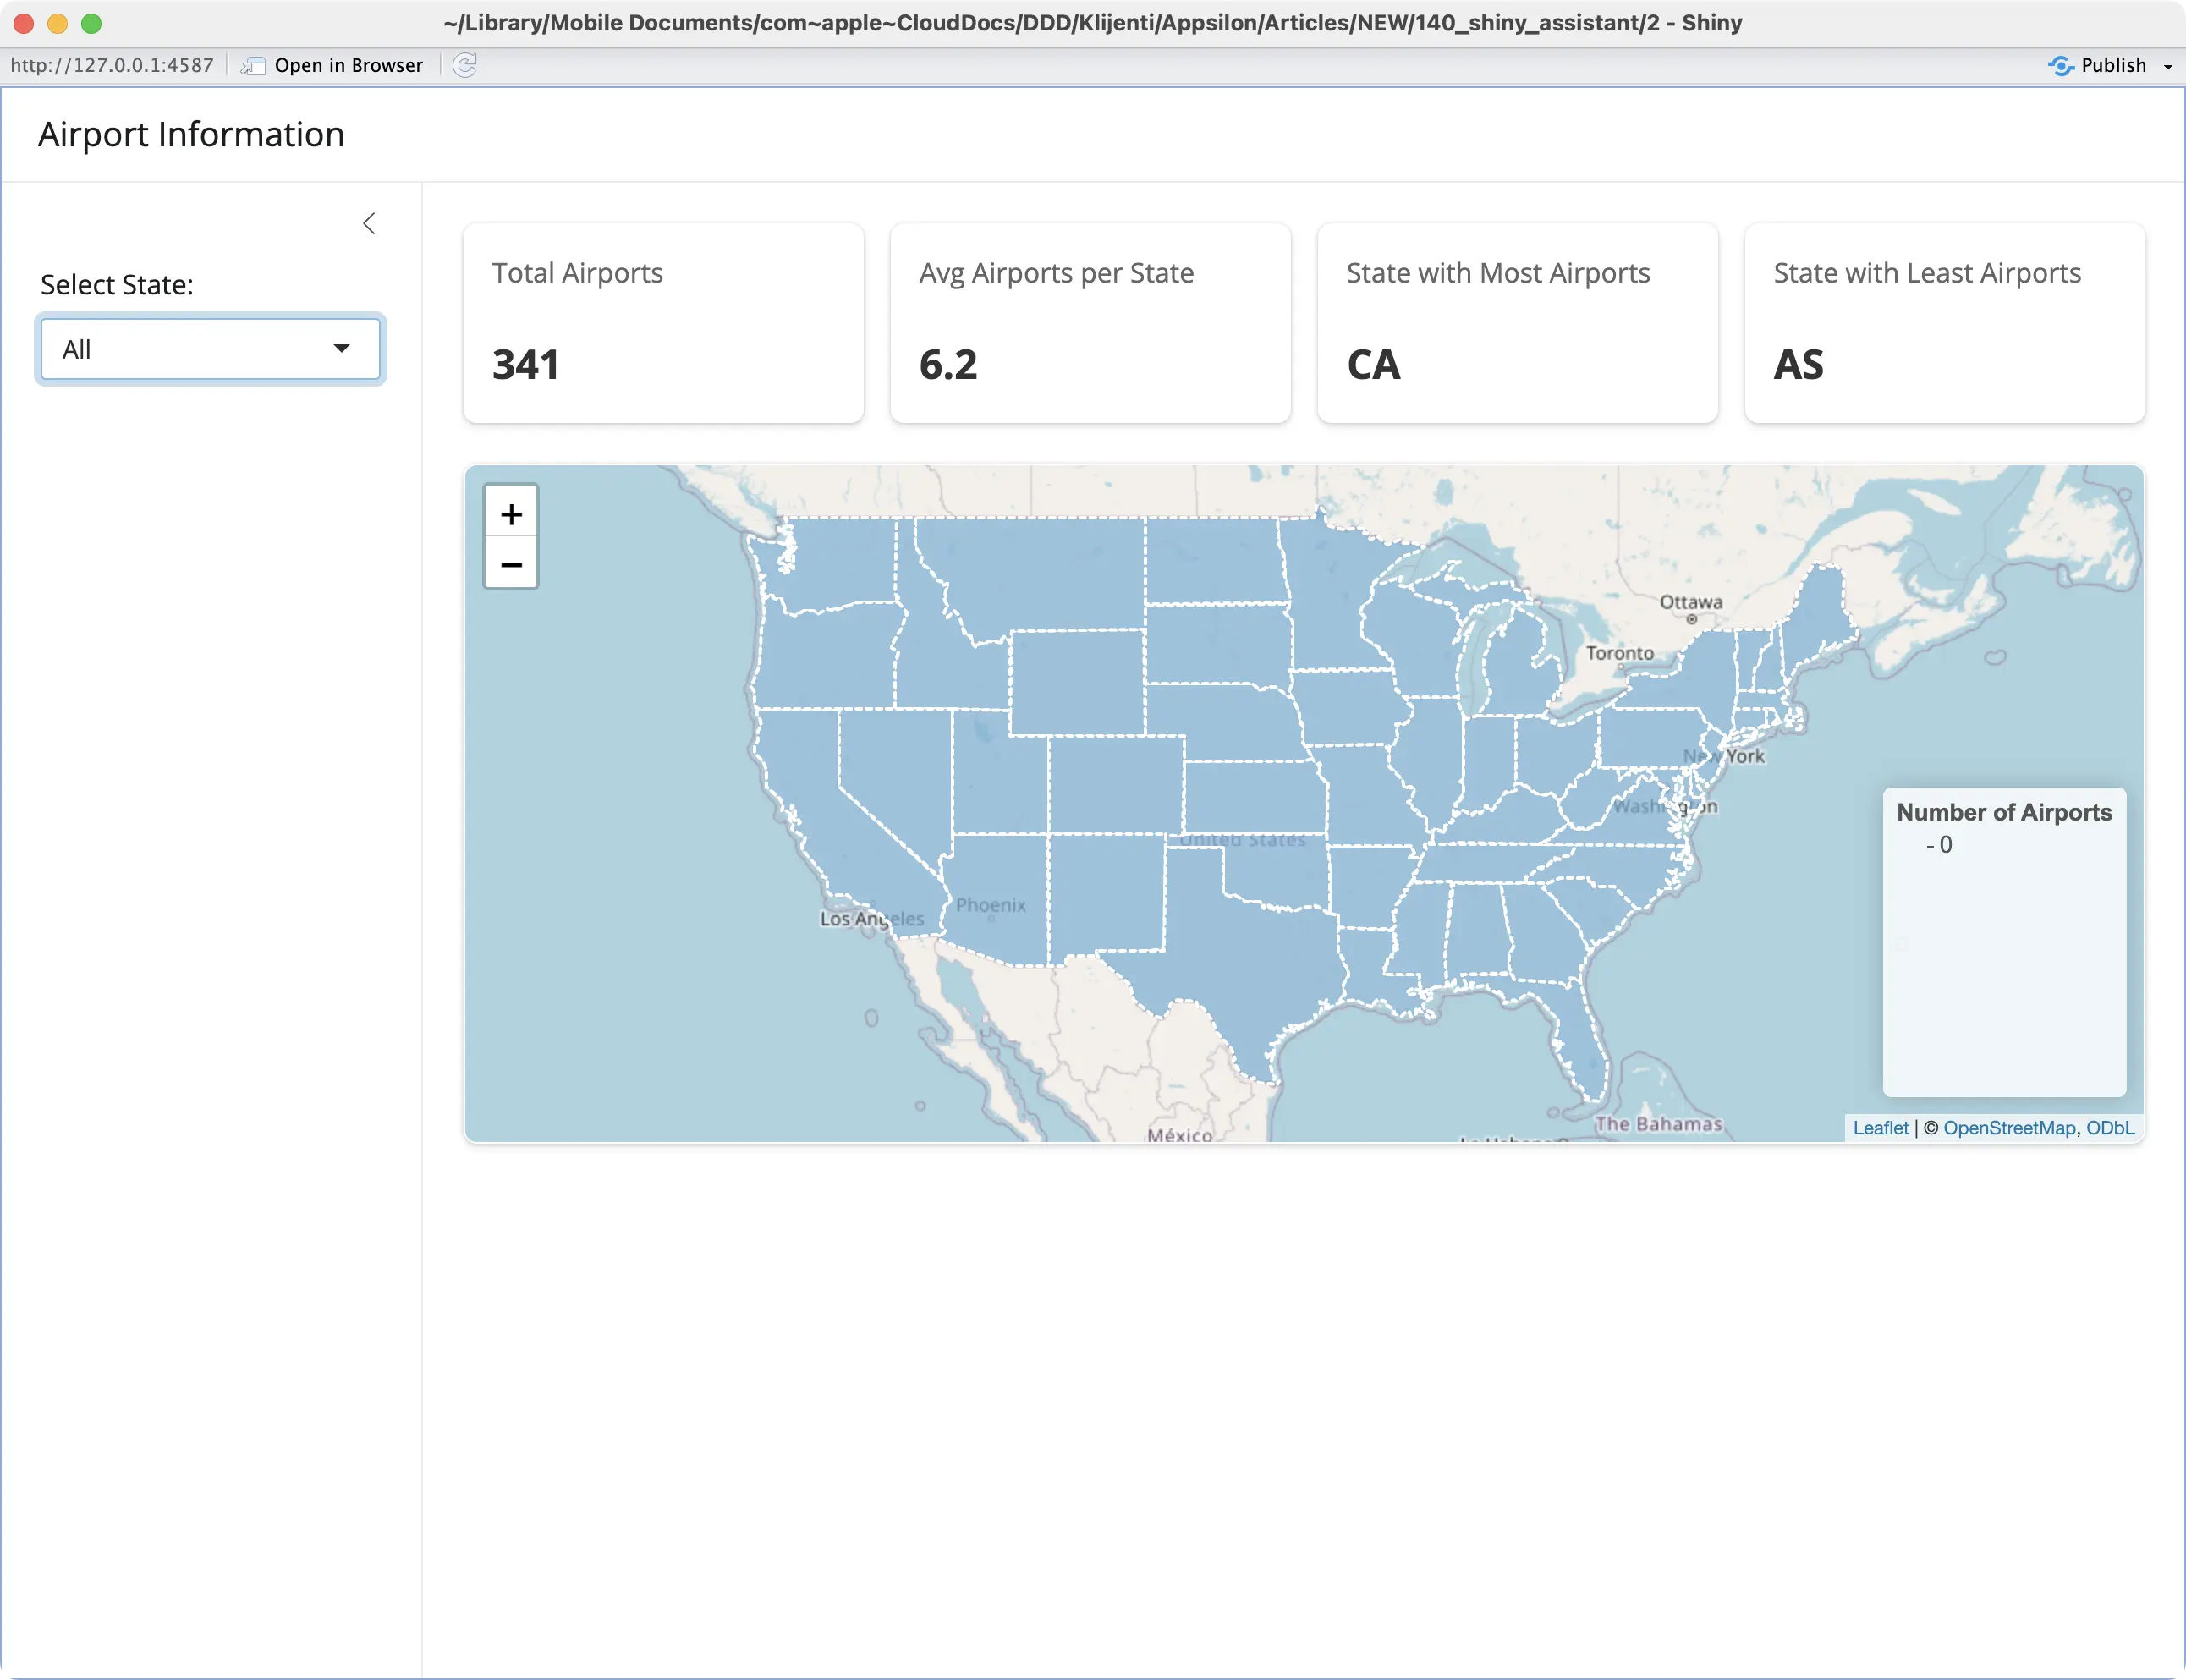
By the end, you’ll end up with the following app:
Long story short, the app uses the US Airports dataset to provide an overview of airport locations for the entire United States and per individual state.
You can find the source code (without test cases) at the end of this section.
Let’s start with the first prompt!
Prompt #1 - Data Familiarization and UI Structure
The idea is to start small and let Shiny Assistant get familiar with the dataset and project requirements.
This is the prompt we used to provide context about the data and how we want the UI to be structured. Note that no UI elements are constructed yet, except for the filter used to select the state. We’ve also instructed the Assistant to have responsive design in mind:
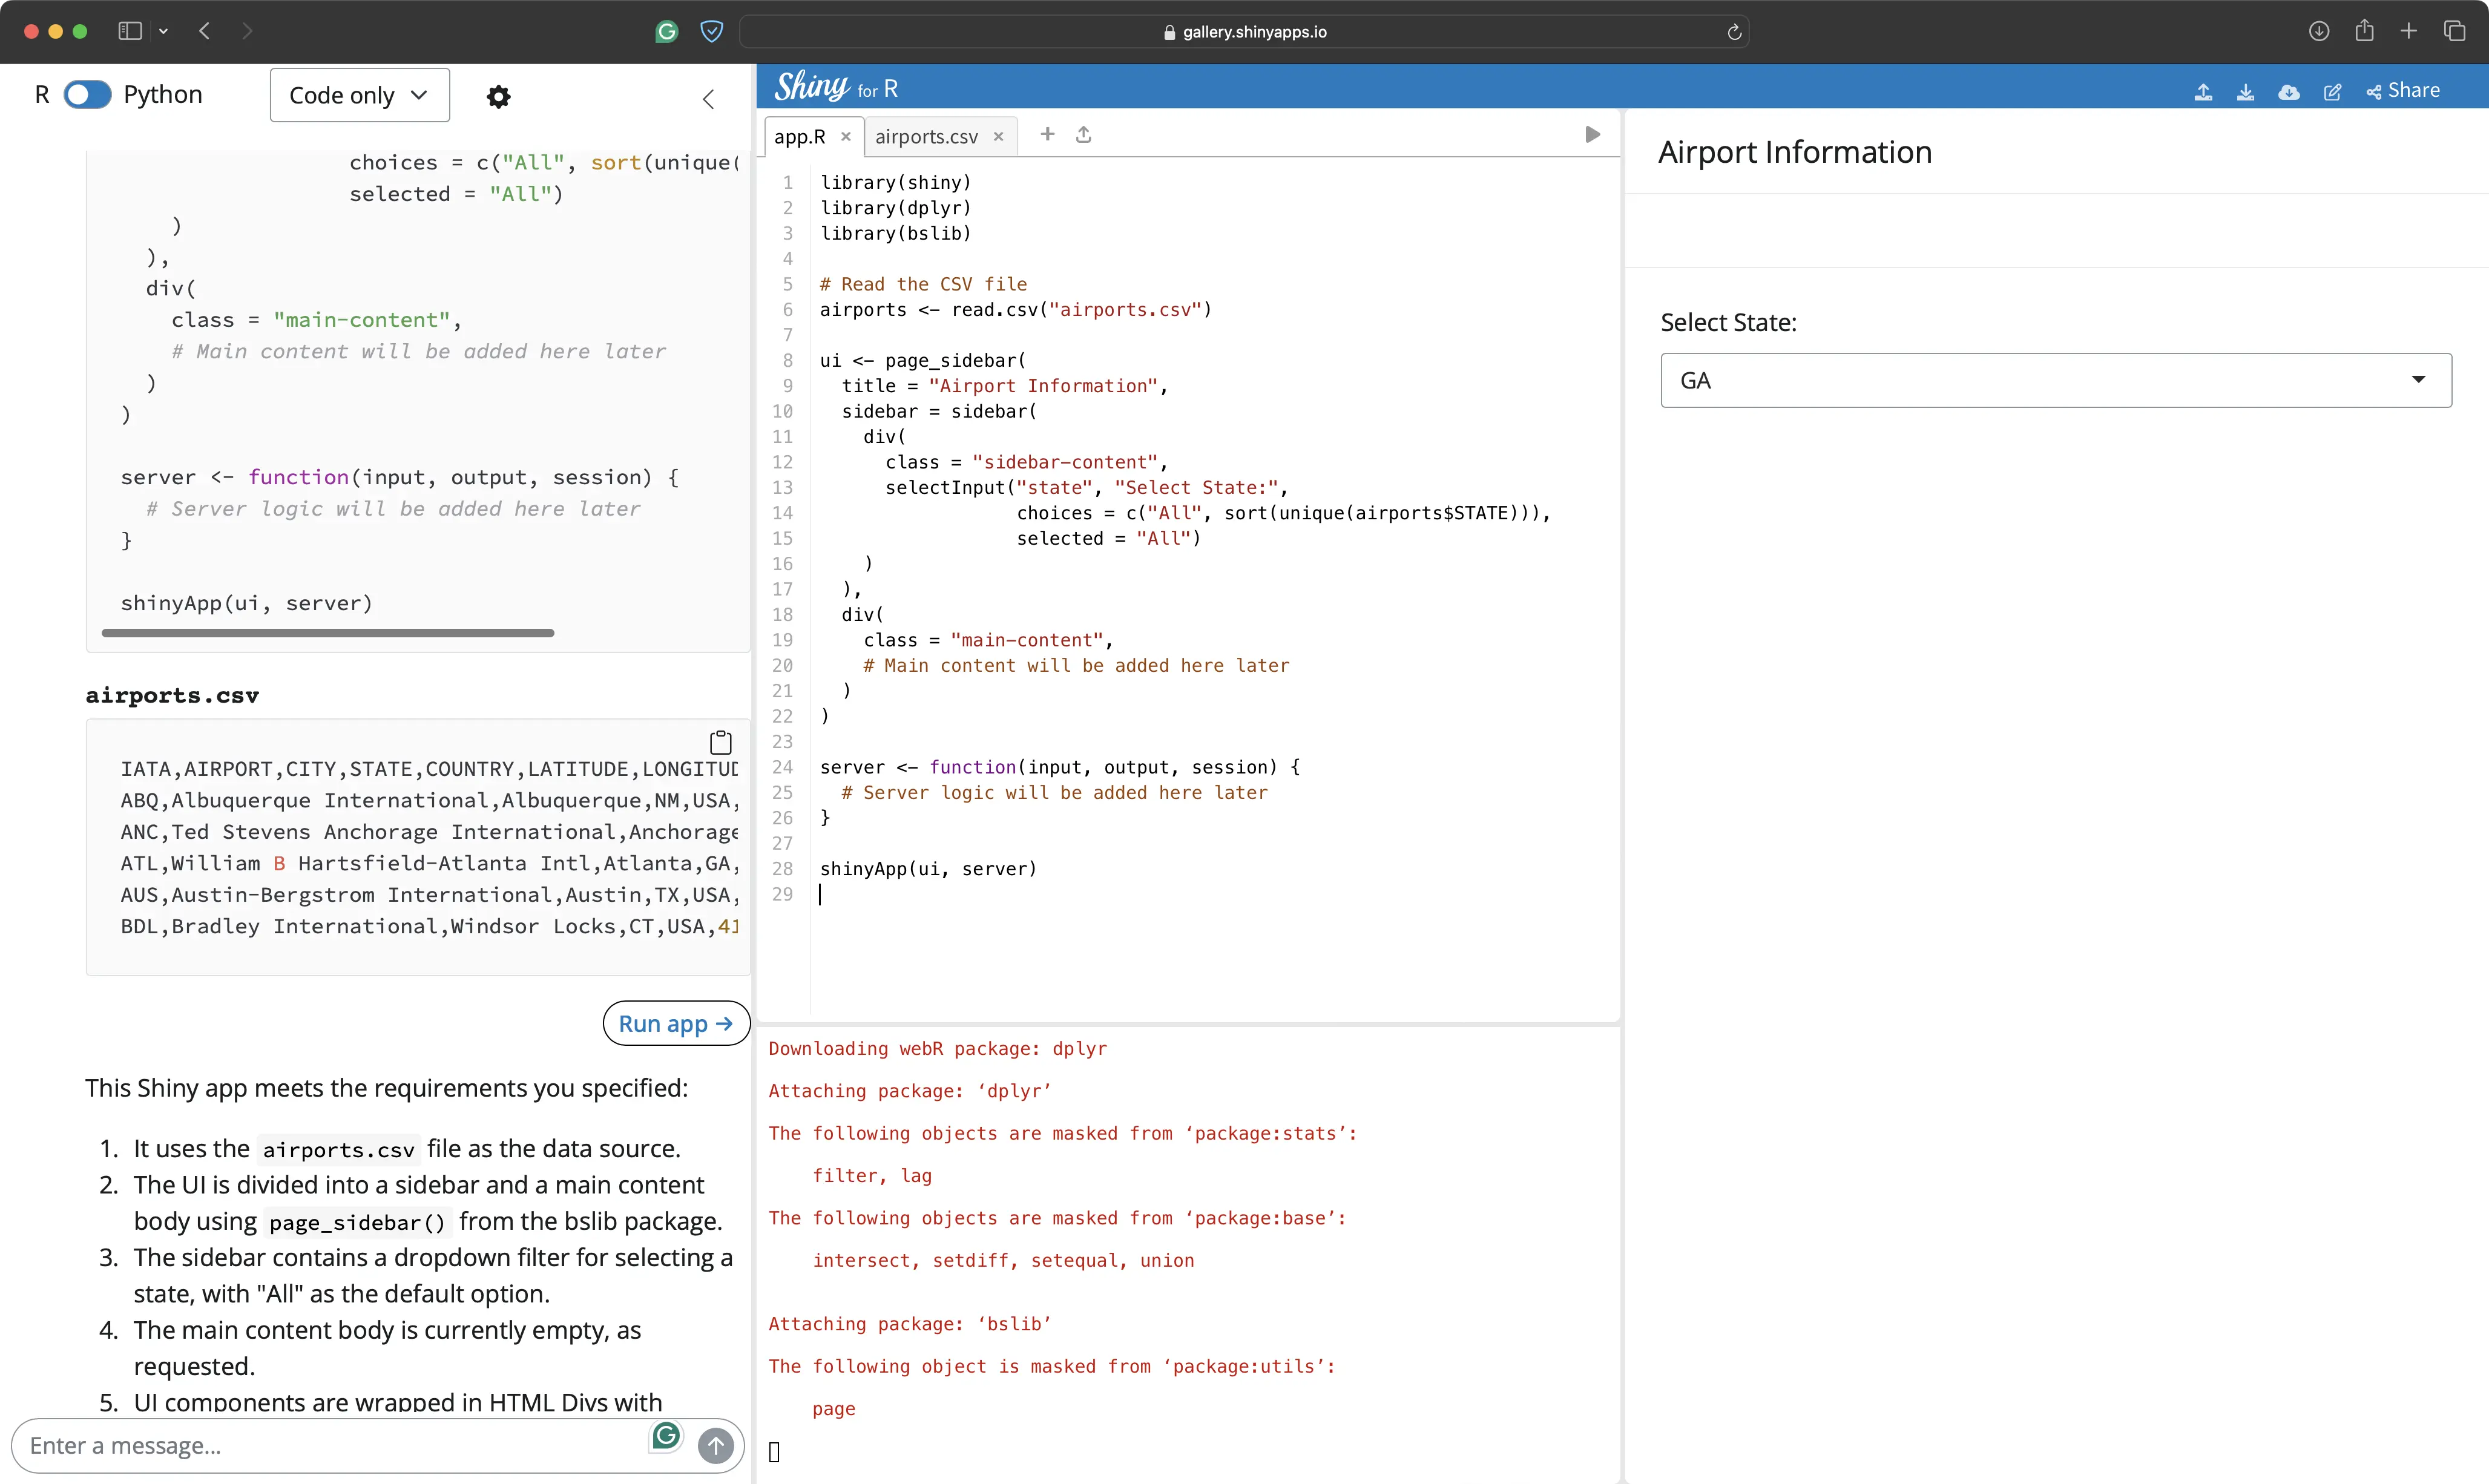
Overall, we were satisfied with the response.
Shiny Assistant understood the context has constructed the UI correctly. The single input allows the user to view statistics for all states and on an individual state level.
The Assistant used the `bslib` package to handle responsive design. It’s a neat shortcut, but some users might prefer to implement everything from scratch through CSS.
We’ll let it slide this time.
Prompt #2 - Global Summary Statistics
The first UI component we want to build is a set of global statistics.
It should only be visible when “All” is selected in the state filter and should show four cards with the following information:
- Total number of airports
- Average number of airports per state
- The state with the most airports
- The state with the least airports
It’s quite basic, sure, but will give you an idea of how Shiny Assistant works with data aggregation. We’ve also instructed it to lay out the statistics differently on different screen sizes:
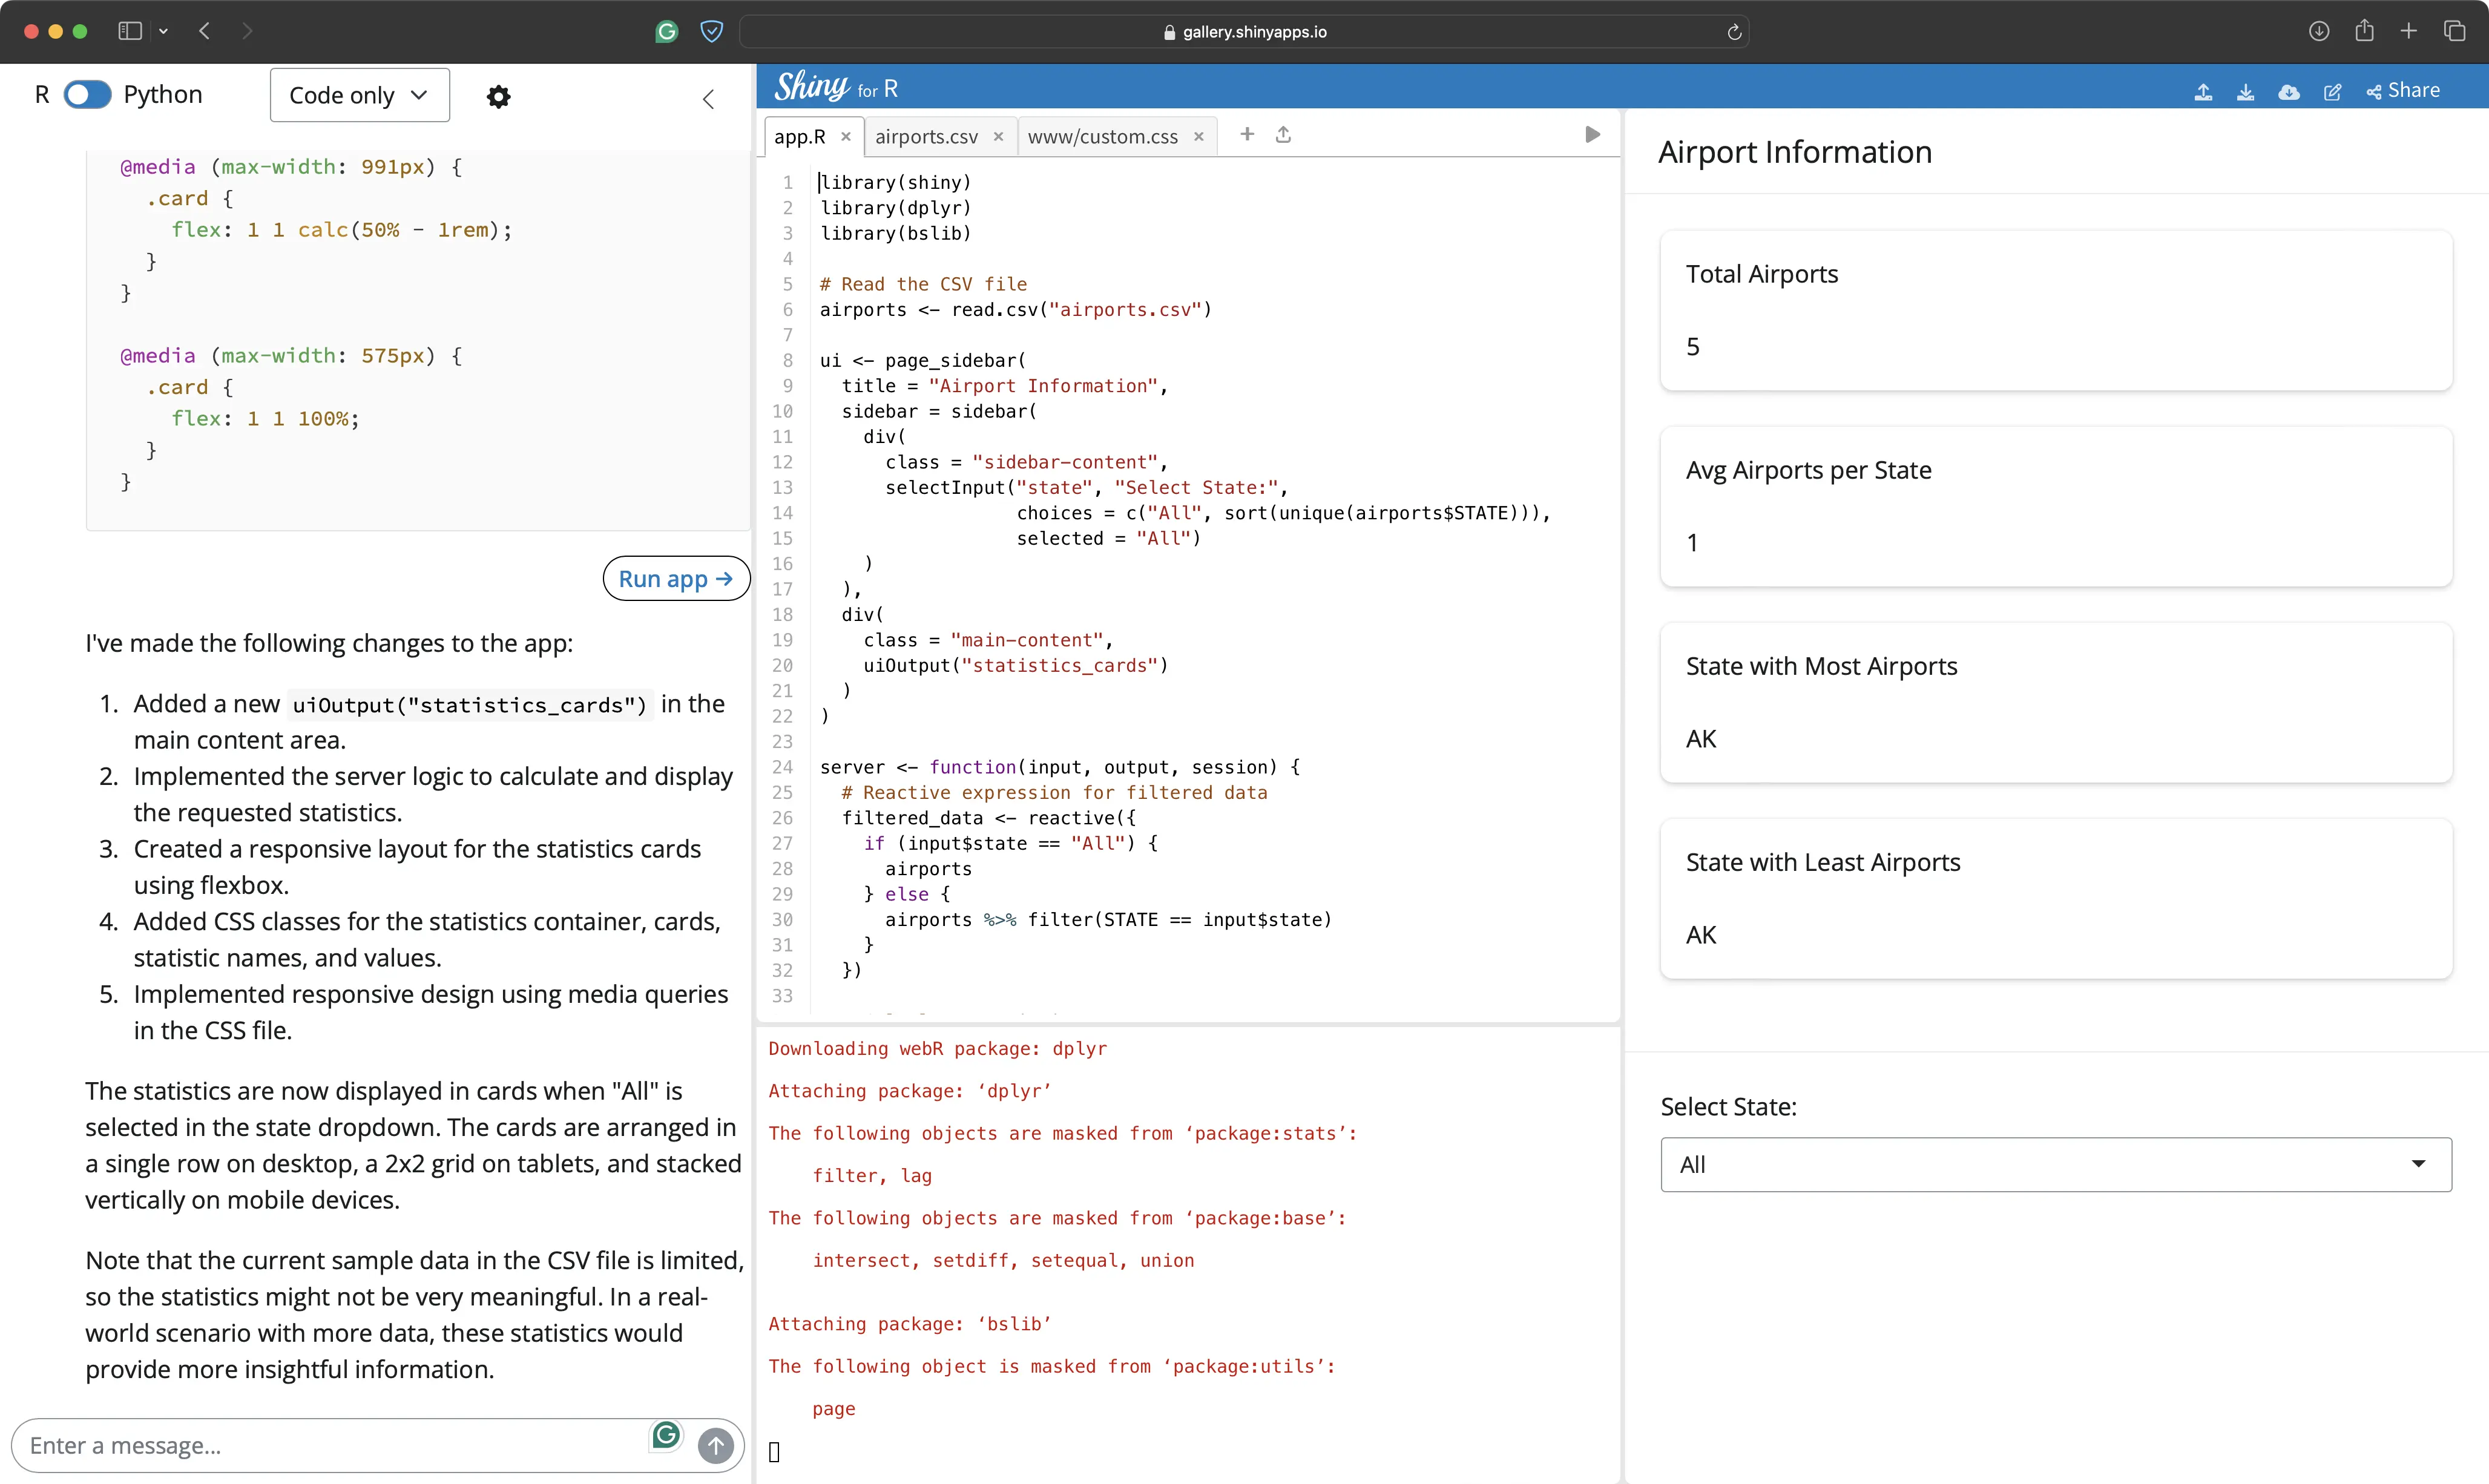
The Assistant returned the R application code and corresponding stylesheets (CSS). It calculated the statistics correctly, and has also layed out the UI correctly. The only problem is - the responsive design doesn’t work:
After inspection, we found that the most obvious thing went wrong - the Assistant forgot to link the stylesheet in the R Shiny application.
Prompt #3 - CSS Linking Issue Fix
To fix this, we manually inserted a line of code and shown the Assistant what was wrong:
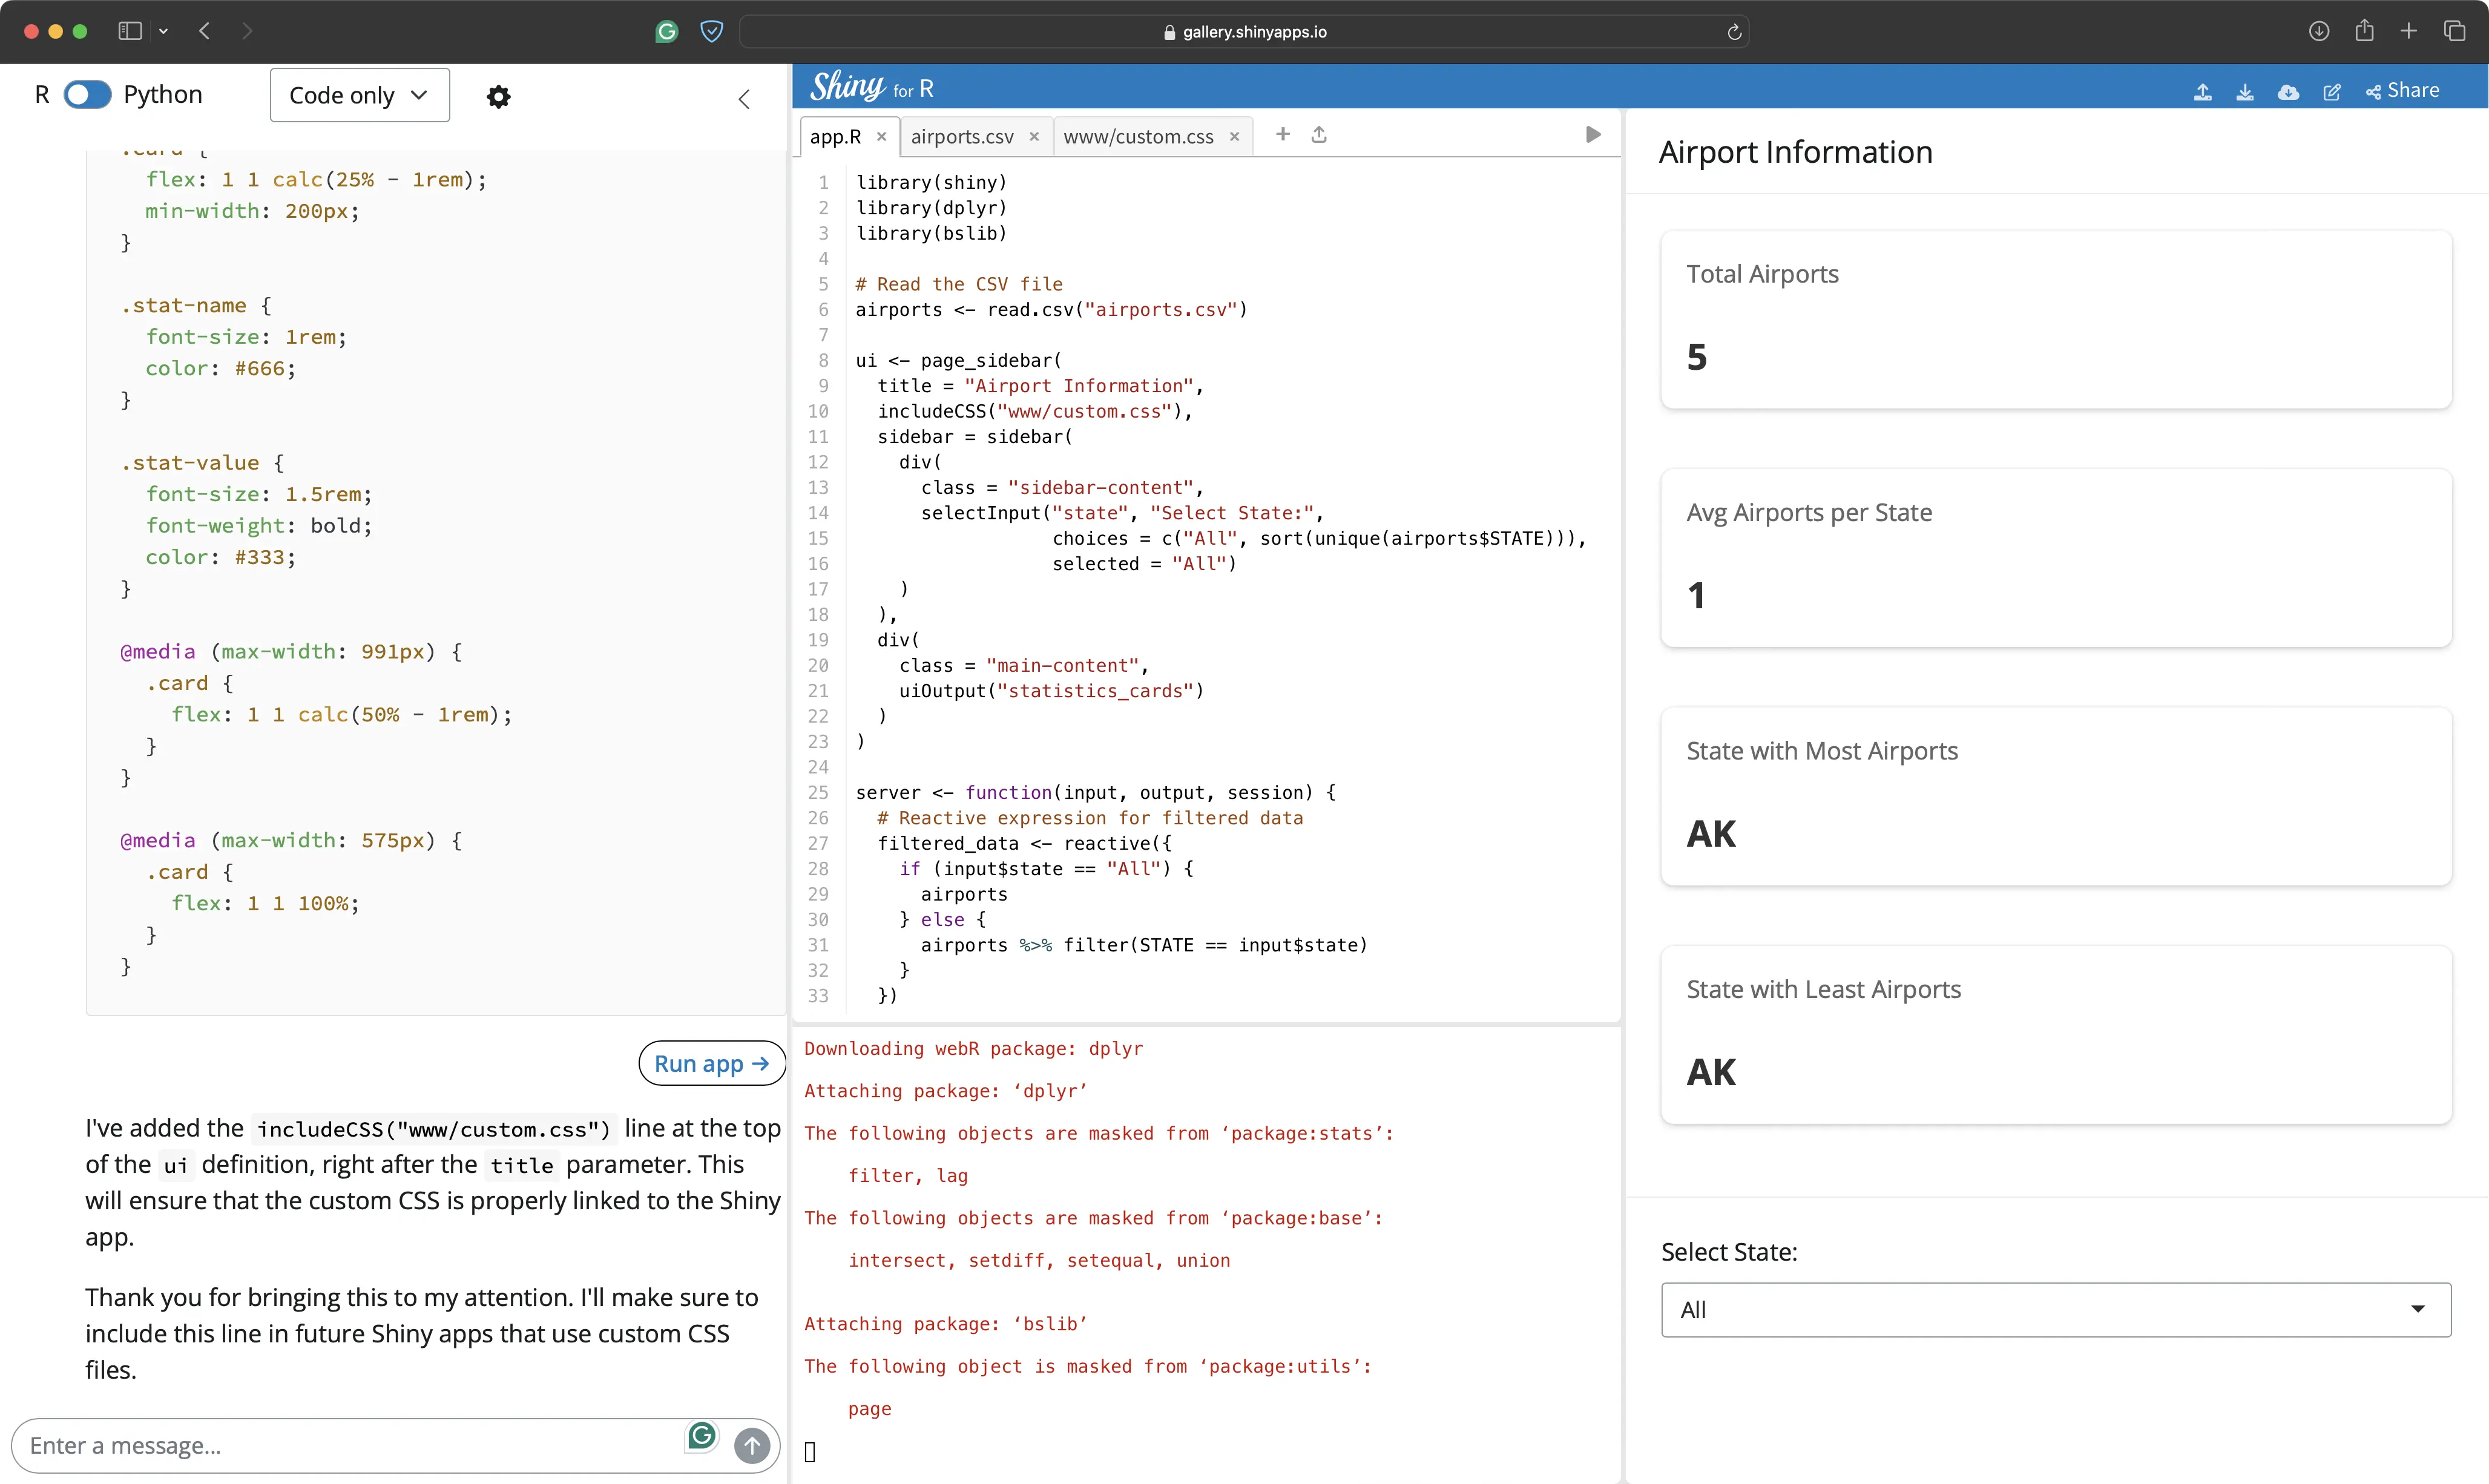
Note that the Assistant has access only to a handful of data samples.
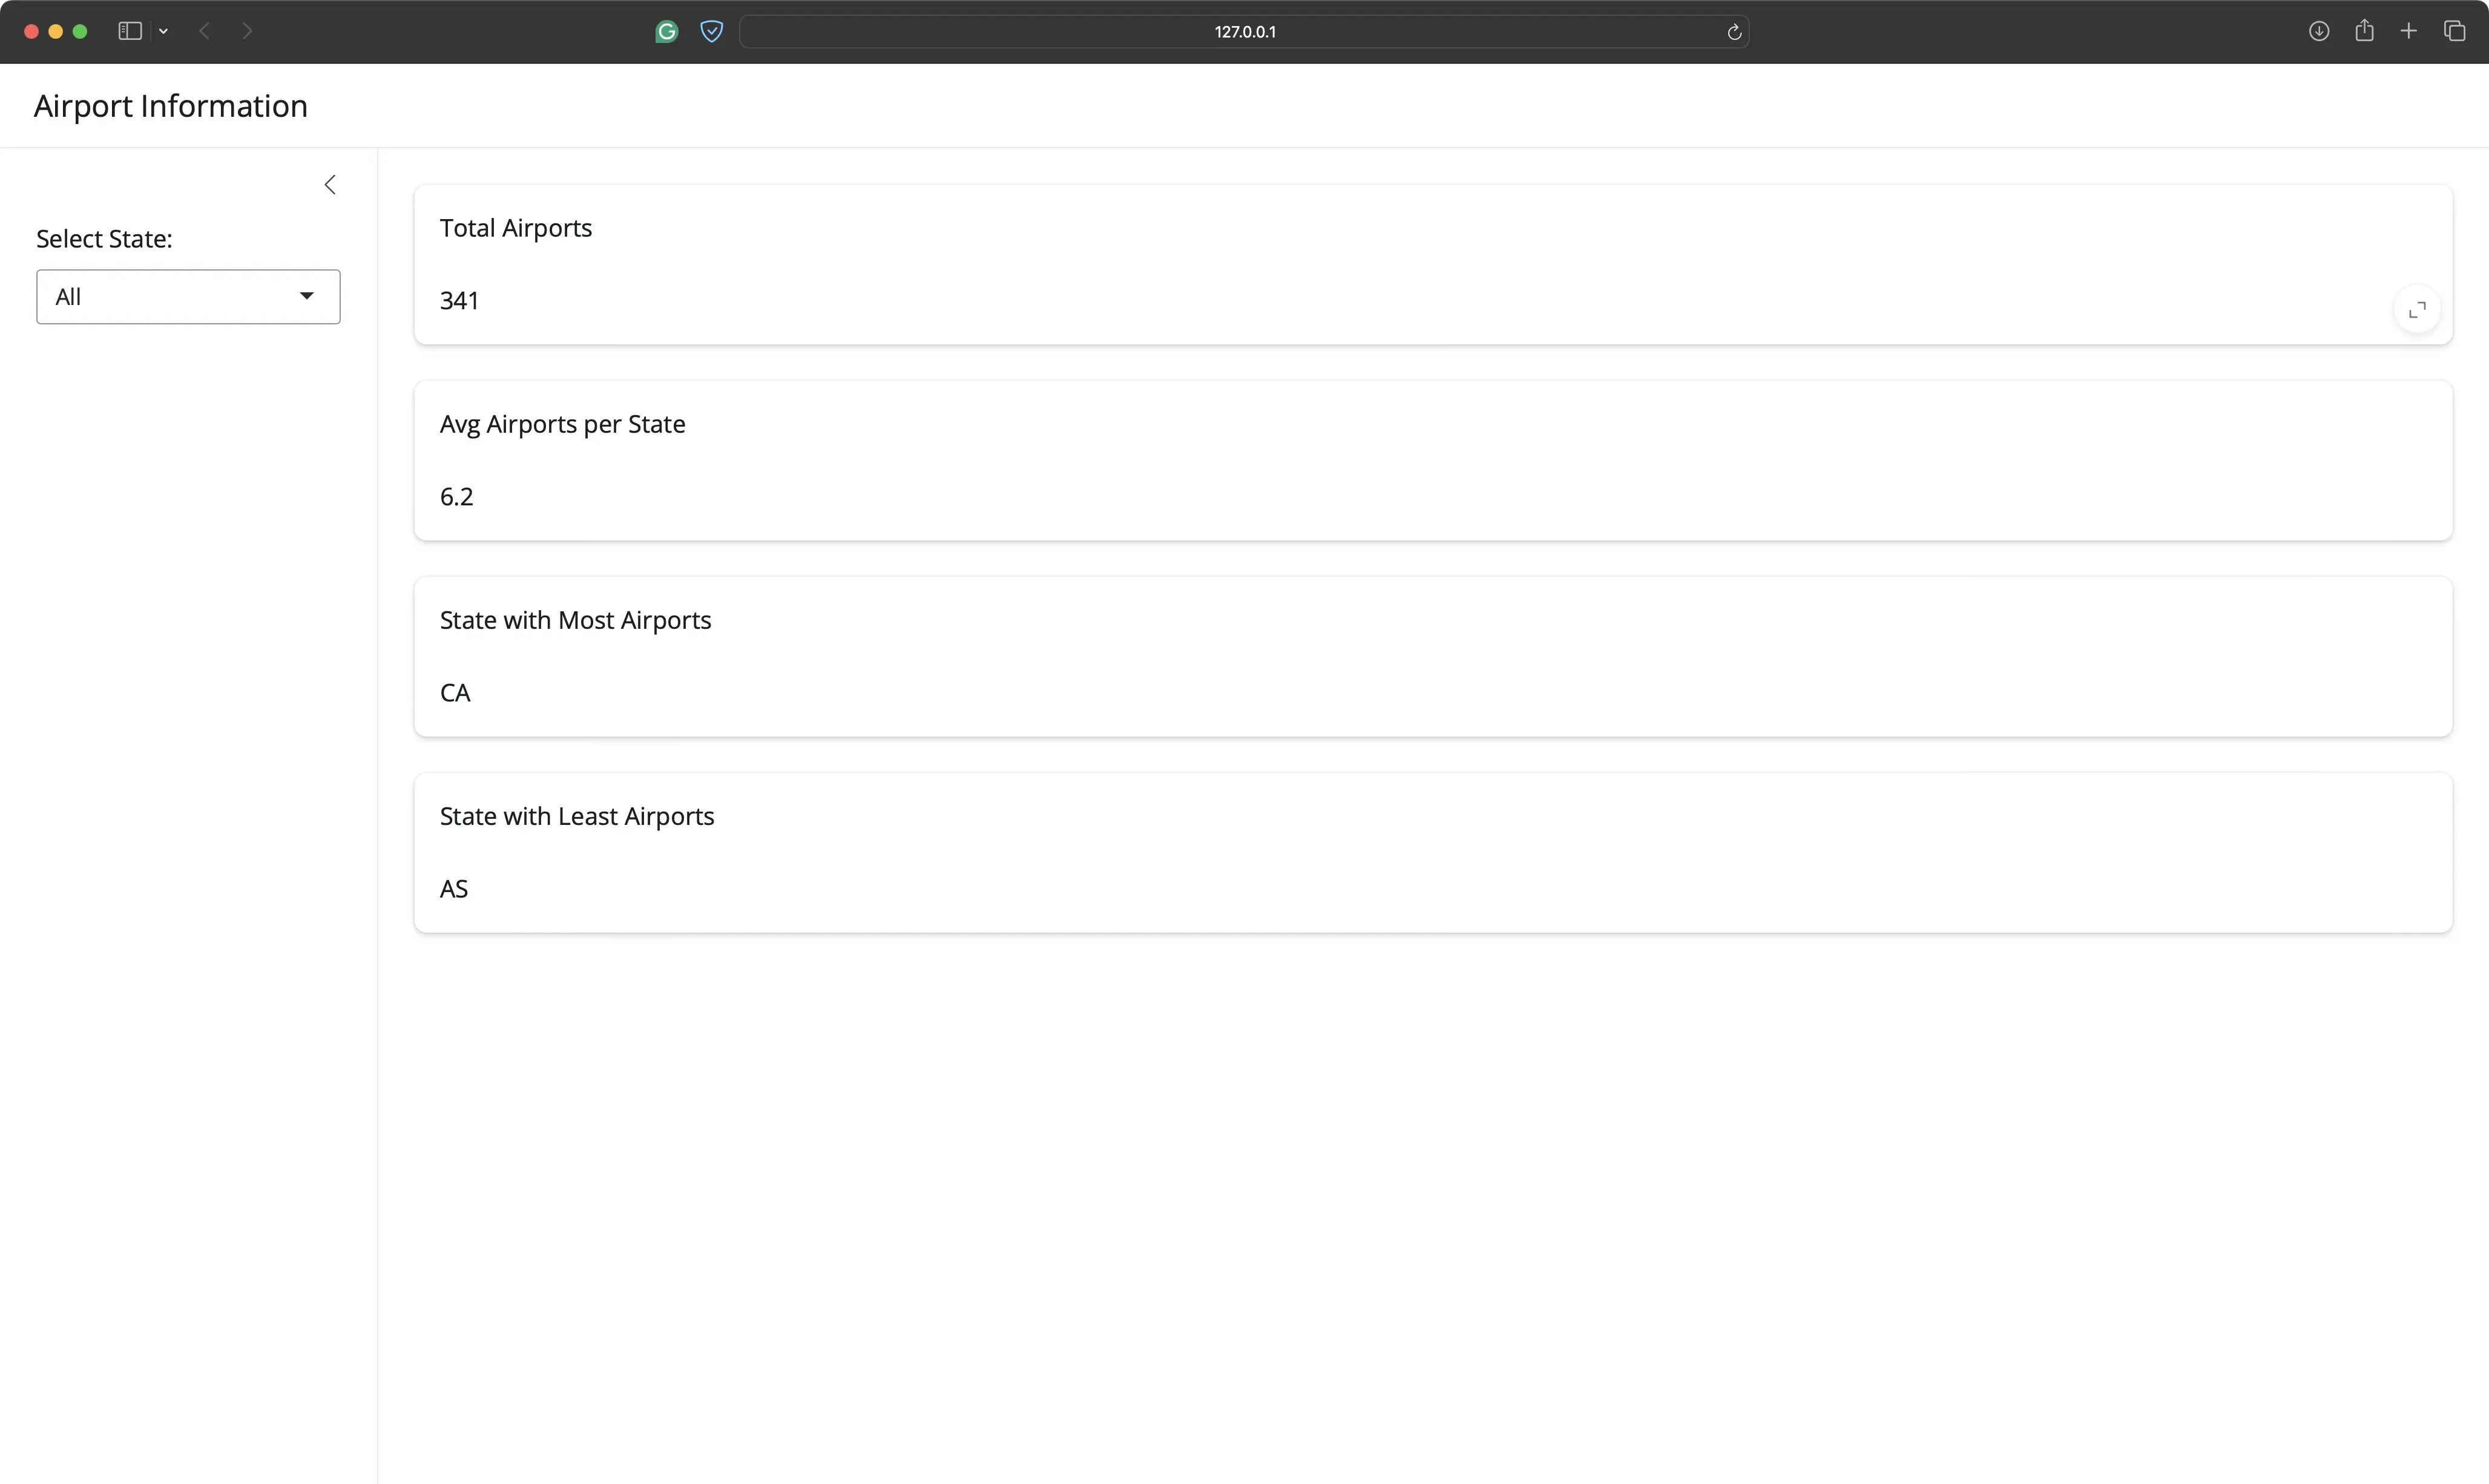
When we copied the code to a local IDE and run the app, the correct values were shown:

This is the only time we’ve manually fixed the Assistant’s mistakes. From now on, we’ll only show the error messages.
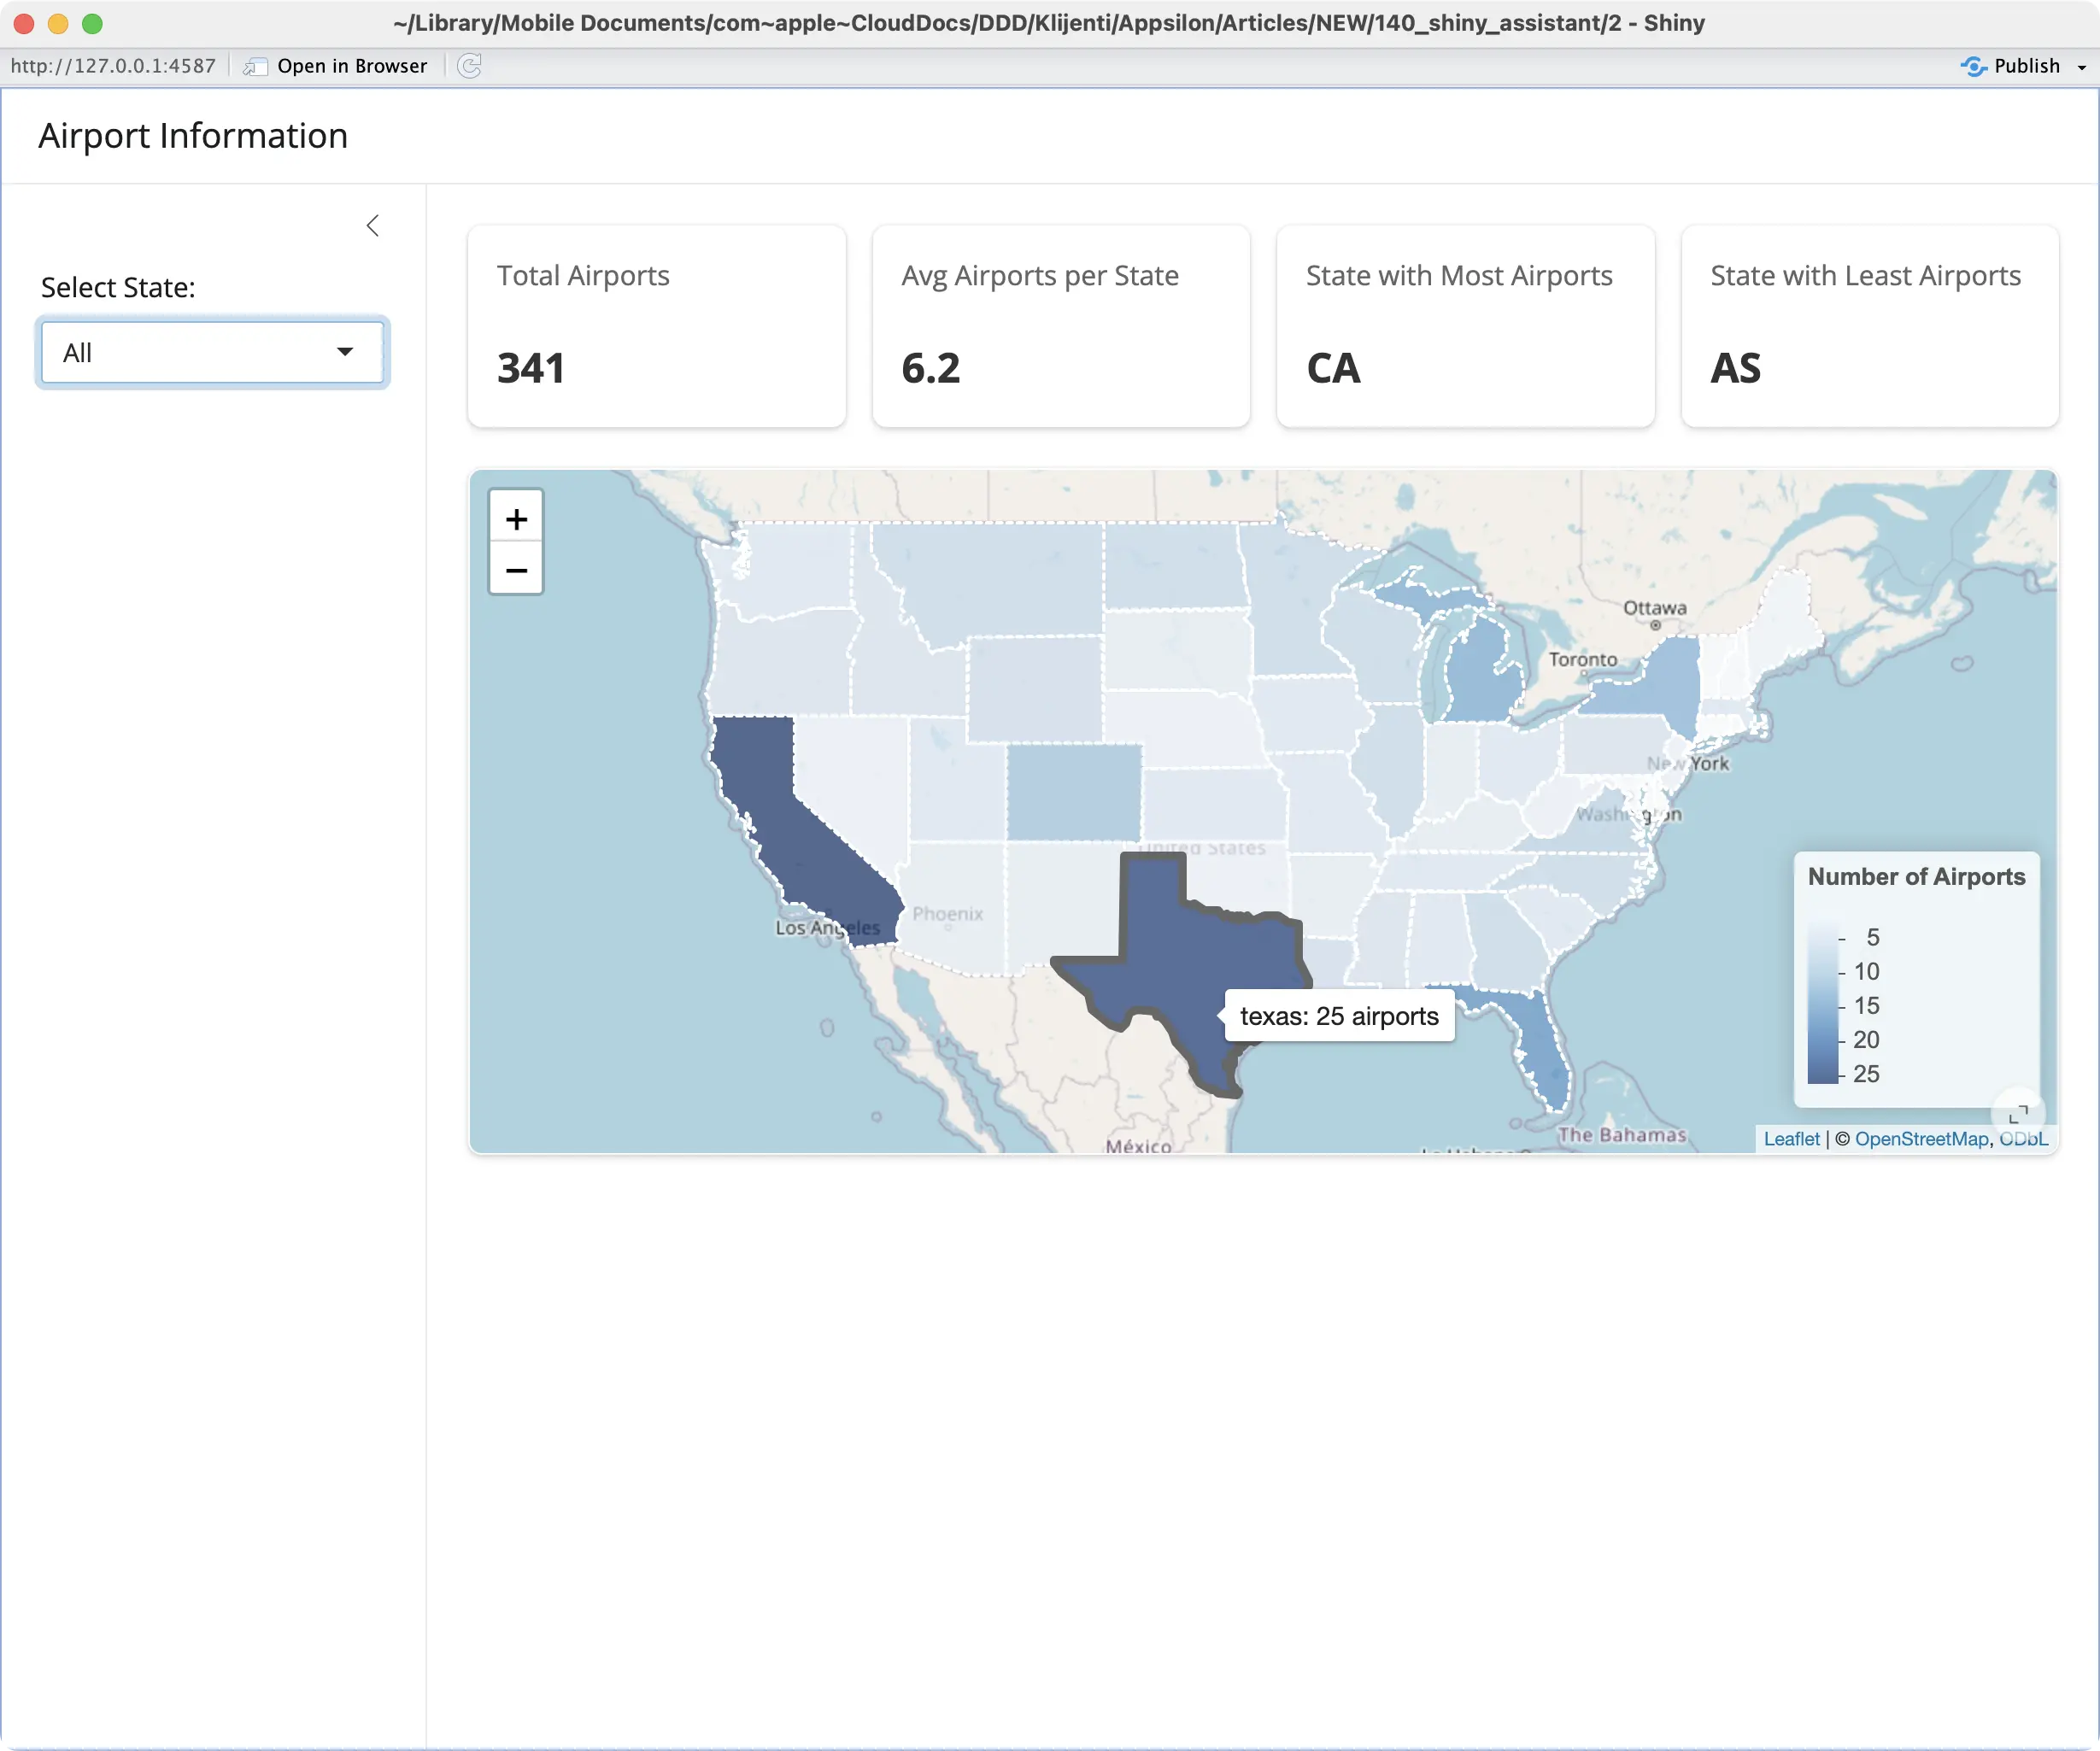
Prompt #4 - Global Choropleth Map
Now the fun part begins!
Probably the most challenging task of the day is building an interactive map. It should be displayed only for global statistics, and should show a choropleth map of all 50 states and their airport counts.
We’ve instructed the Assistant on our color preference and told it to implement a tooltip that’s shown when the user hovers over a single state:
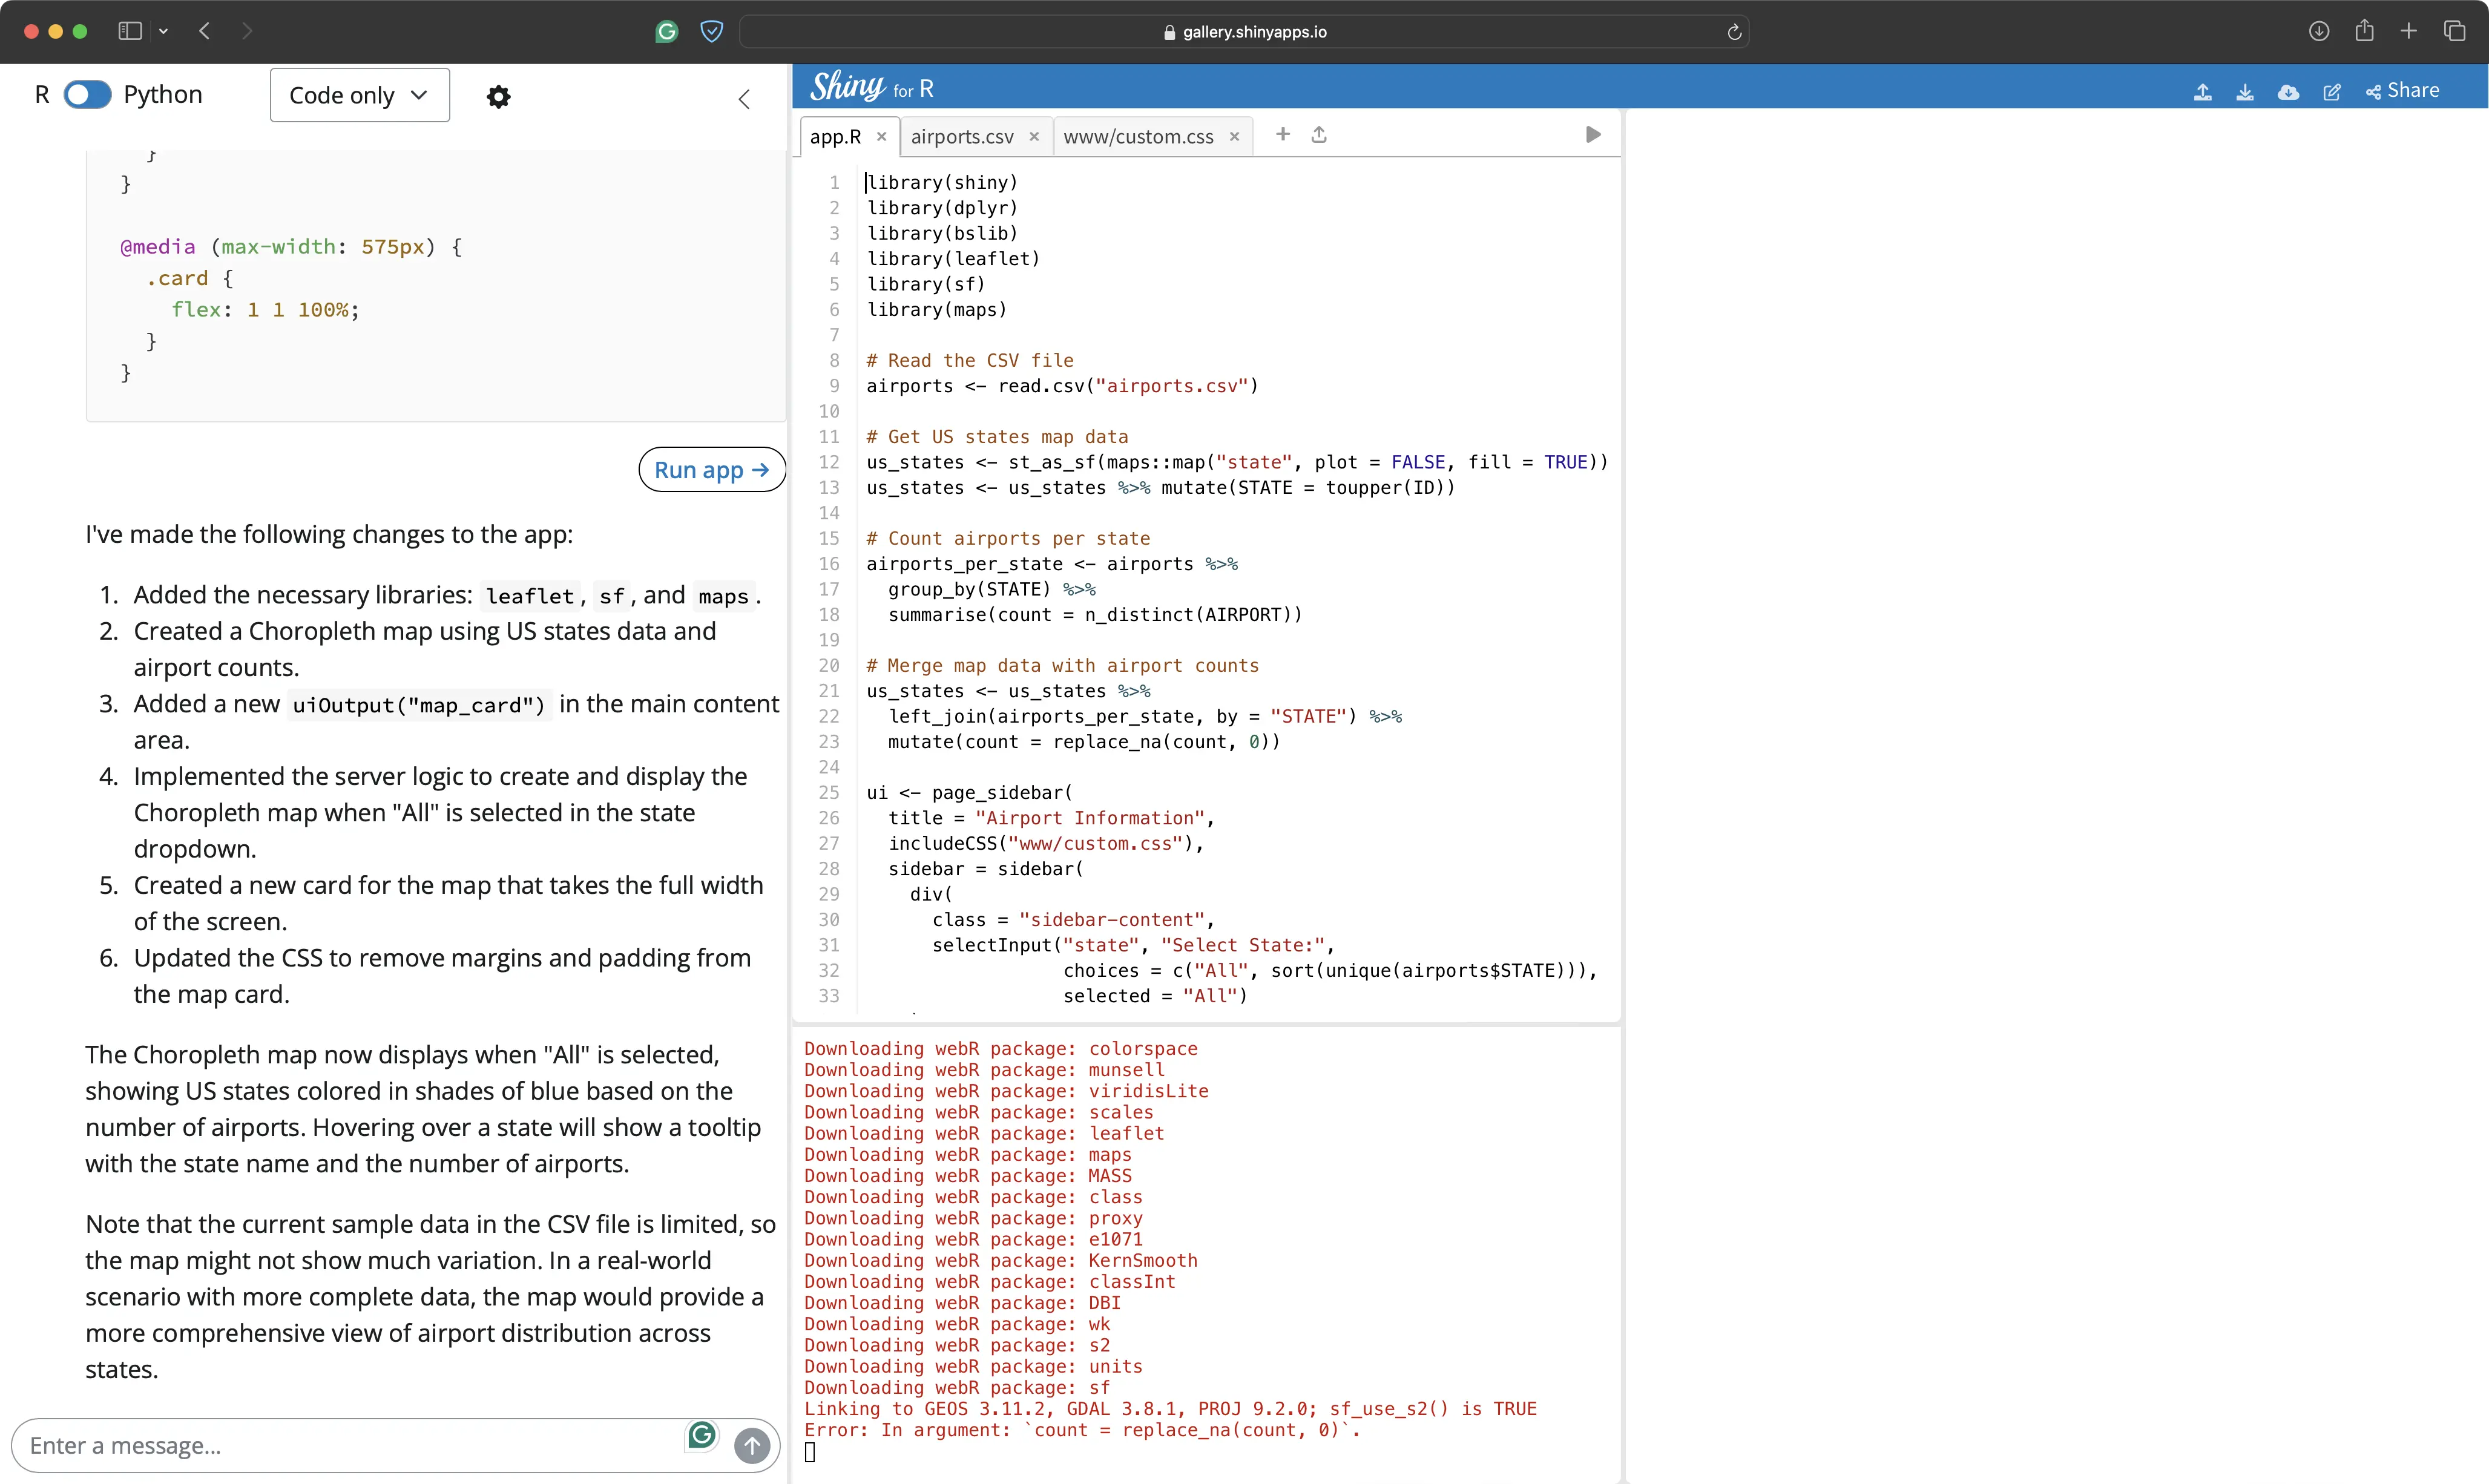
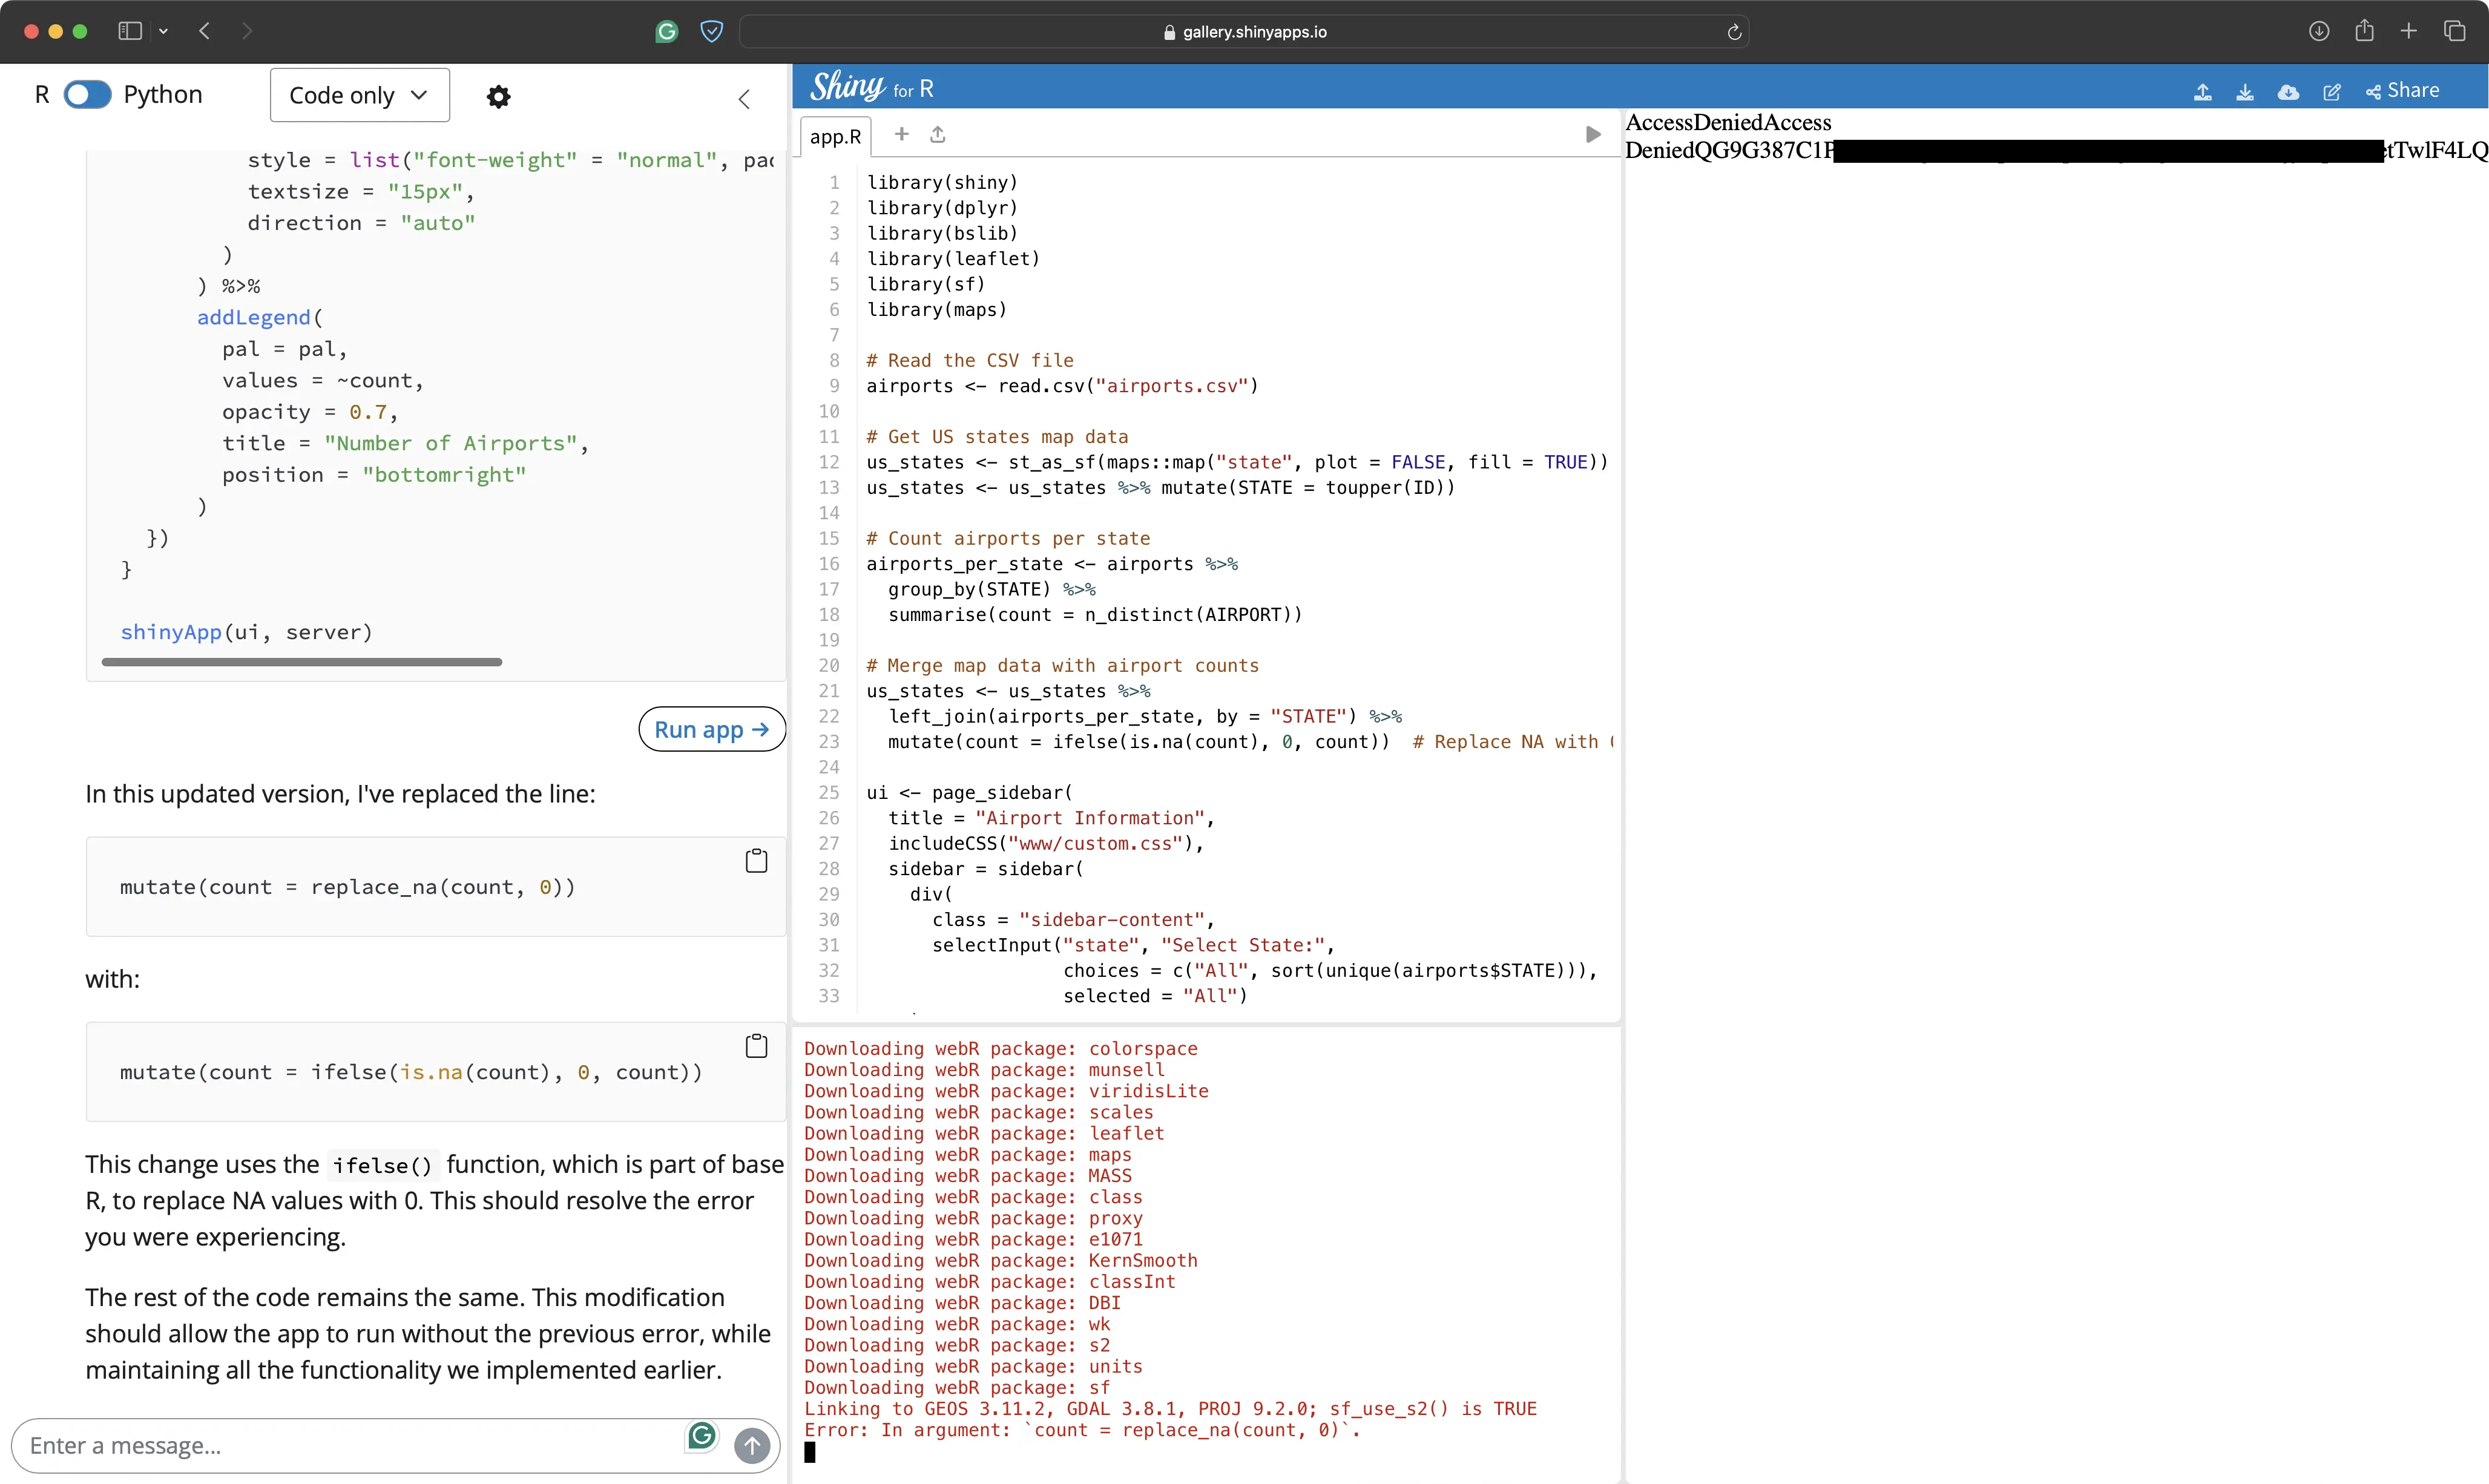
And we got our first error!
Shiny Assistant called a function `replace_na()` that doesn’t exist. The function name sounds reasonable, but it wasn’t found in any of the imported packages.
Prompt #5 - Global Choropleth Map Bug Fix (Iteration 1)
So, let’s instruct it to fix the error.
We’ve copied the error message and provided additional context that the function doesn’t exist:
Shiny Assistant decided to replace the non-existent function with `ifelse()`. Good choice, as it got our app working again:
The map overlay works, but there’s a problem with the airport counts now.
Prompt #6 - Global Choropleth Map Bug Fix (Iteration 2)
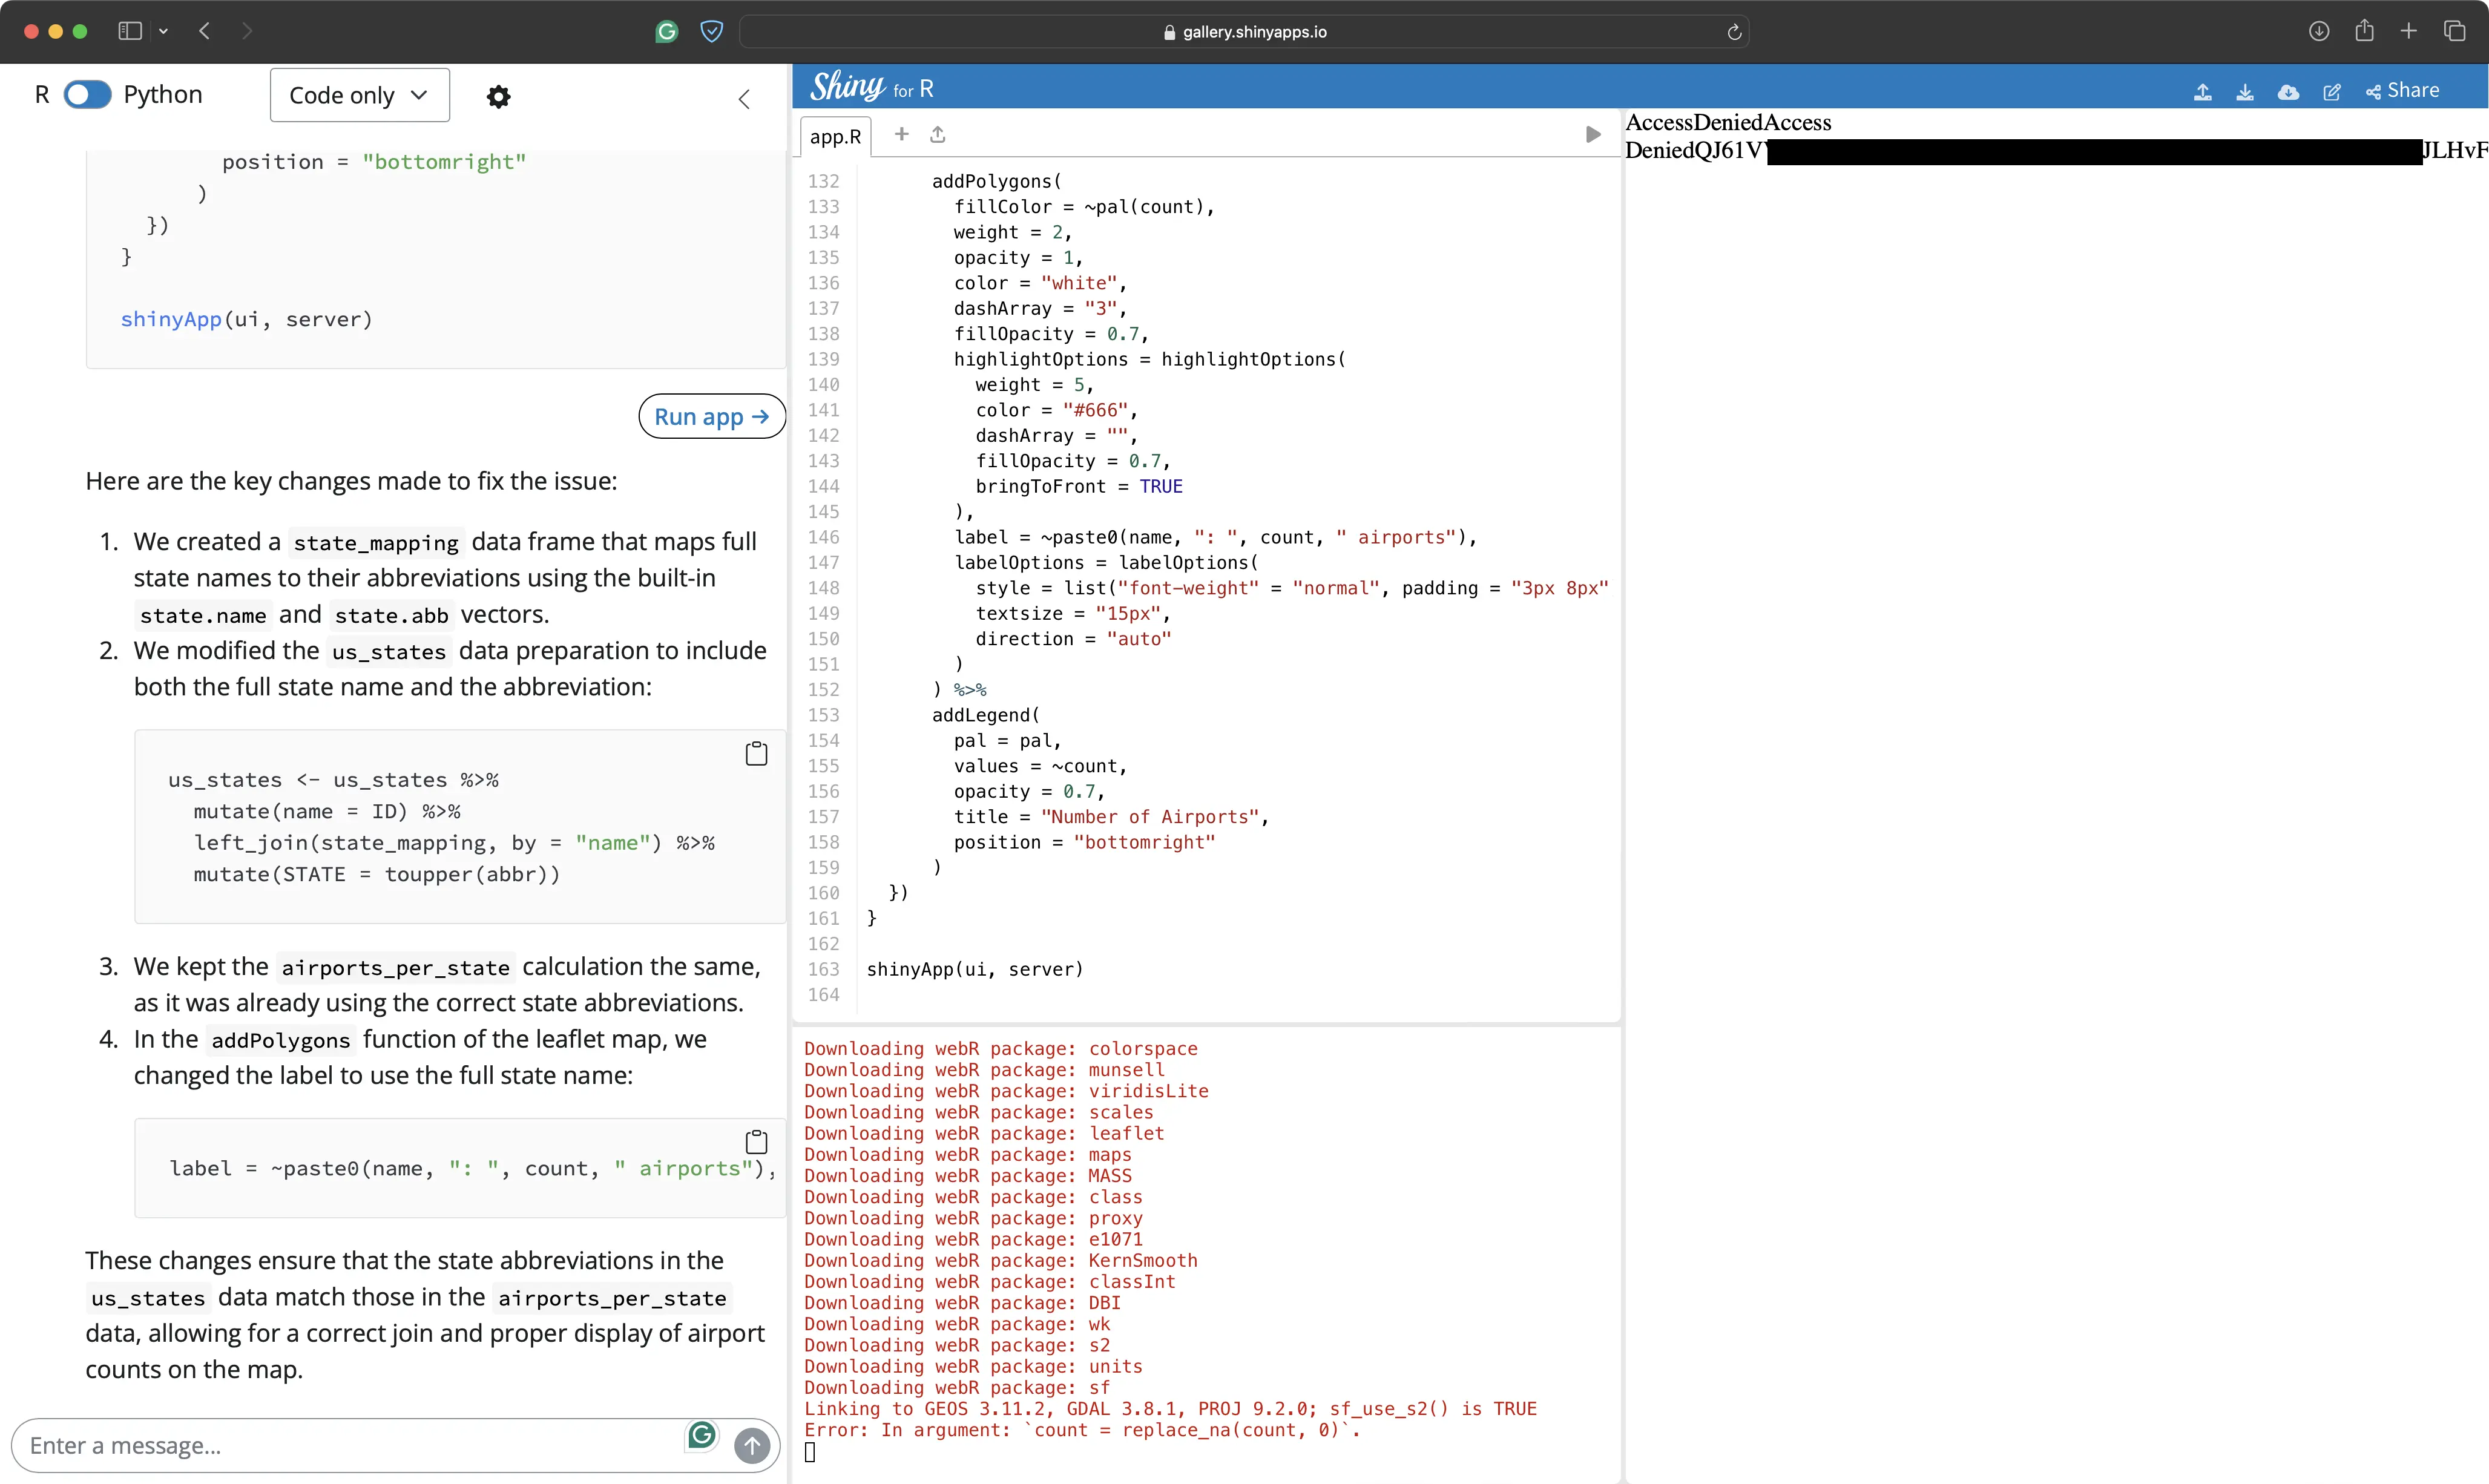
Upon code inspection, we’ve spotted that the generated code is trying to join two data frames on columns that have different values:
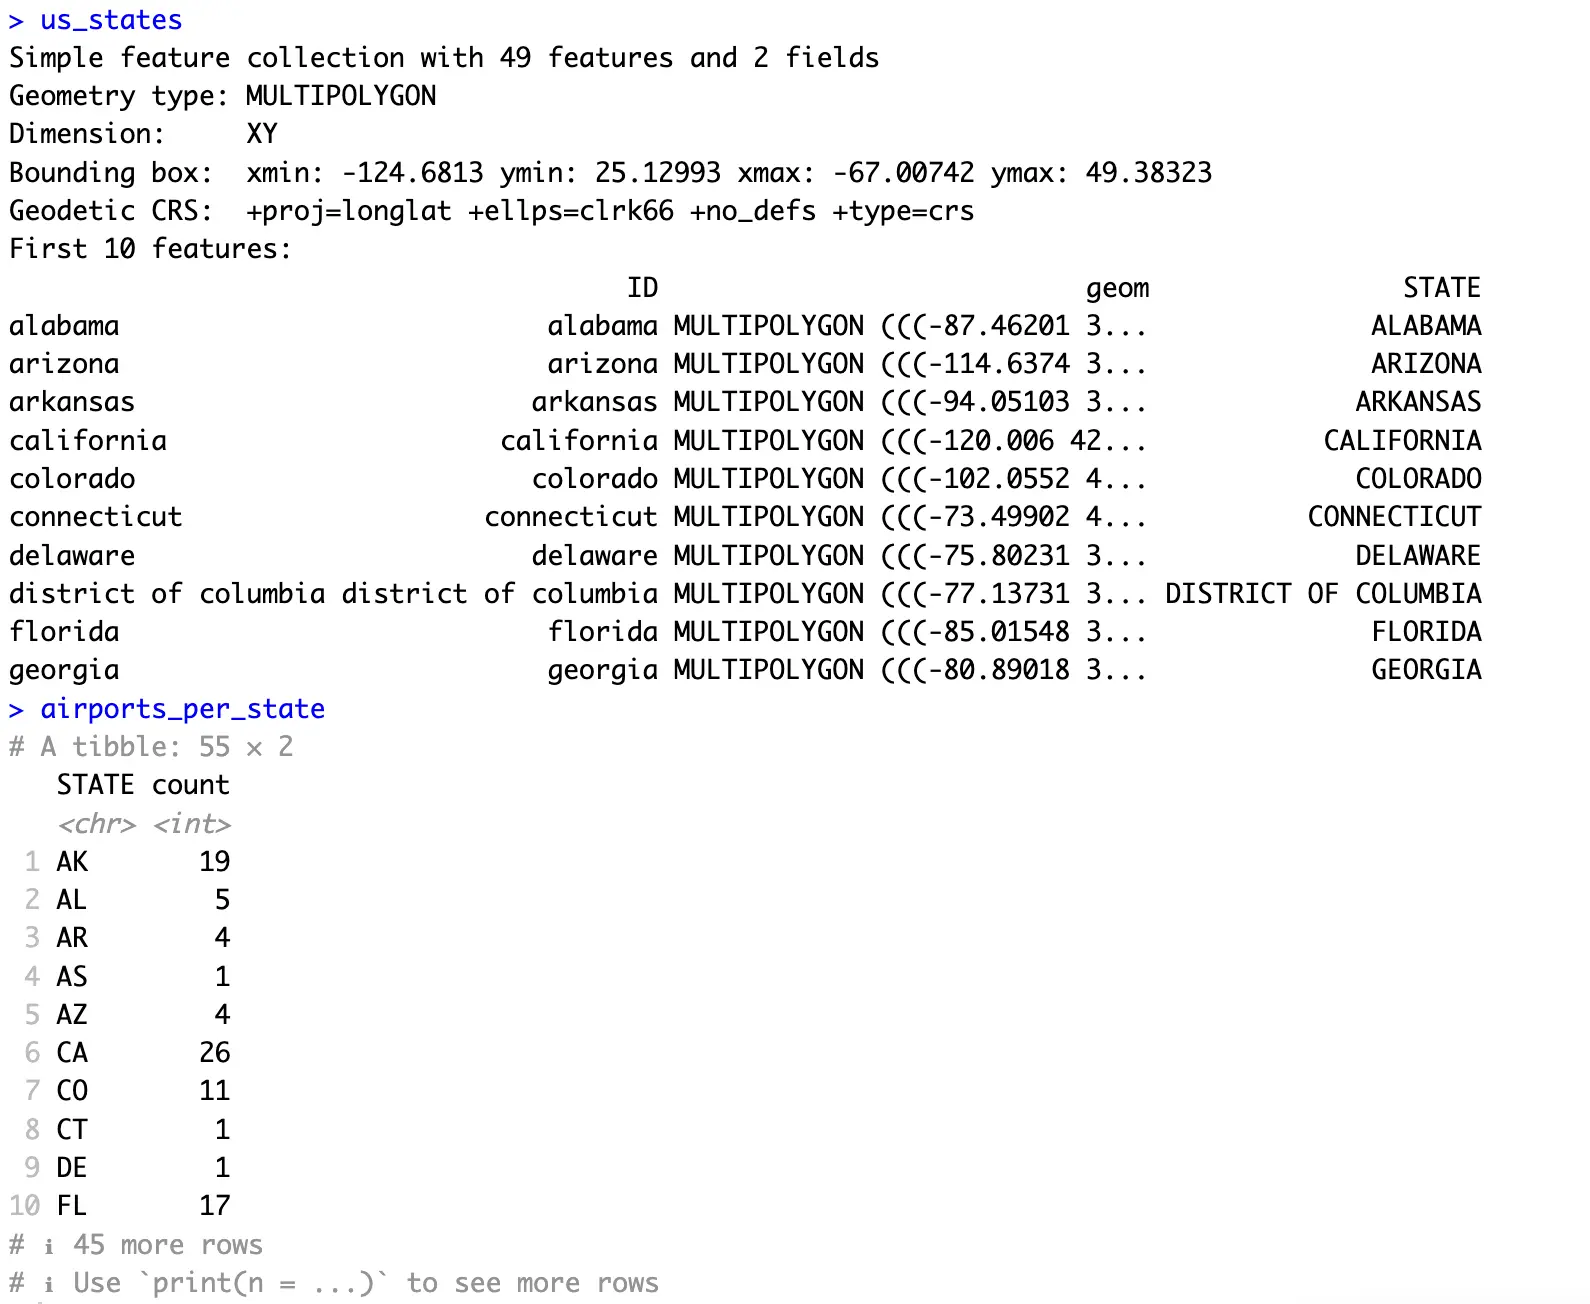
One shows state names as a two-letter abbreviation (e.g., CA), while the other contains full state names (e.g., California). The semantic information is there, but that’s not enough for a data frame join to work with.
We’ve pointed out this error to the Assistant:
The live display functionality has stopped working in Shiny Assistant, so all further screenshots will be from the app running locally.
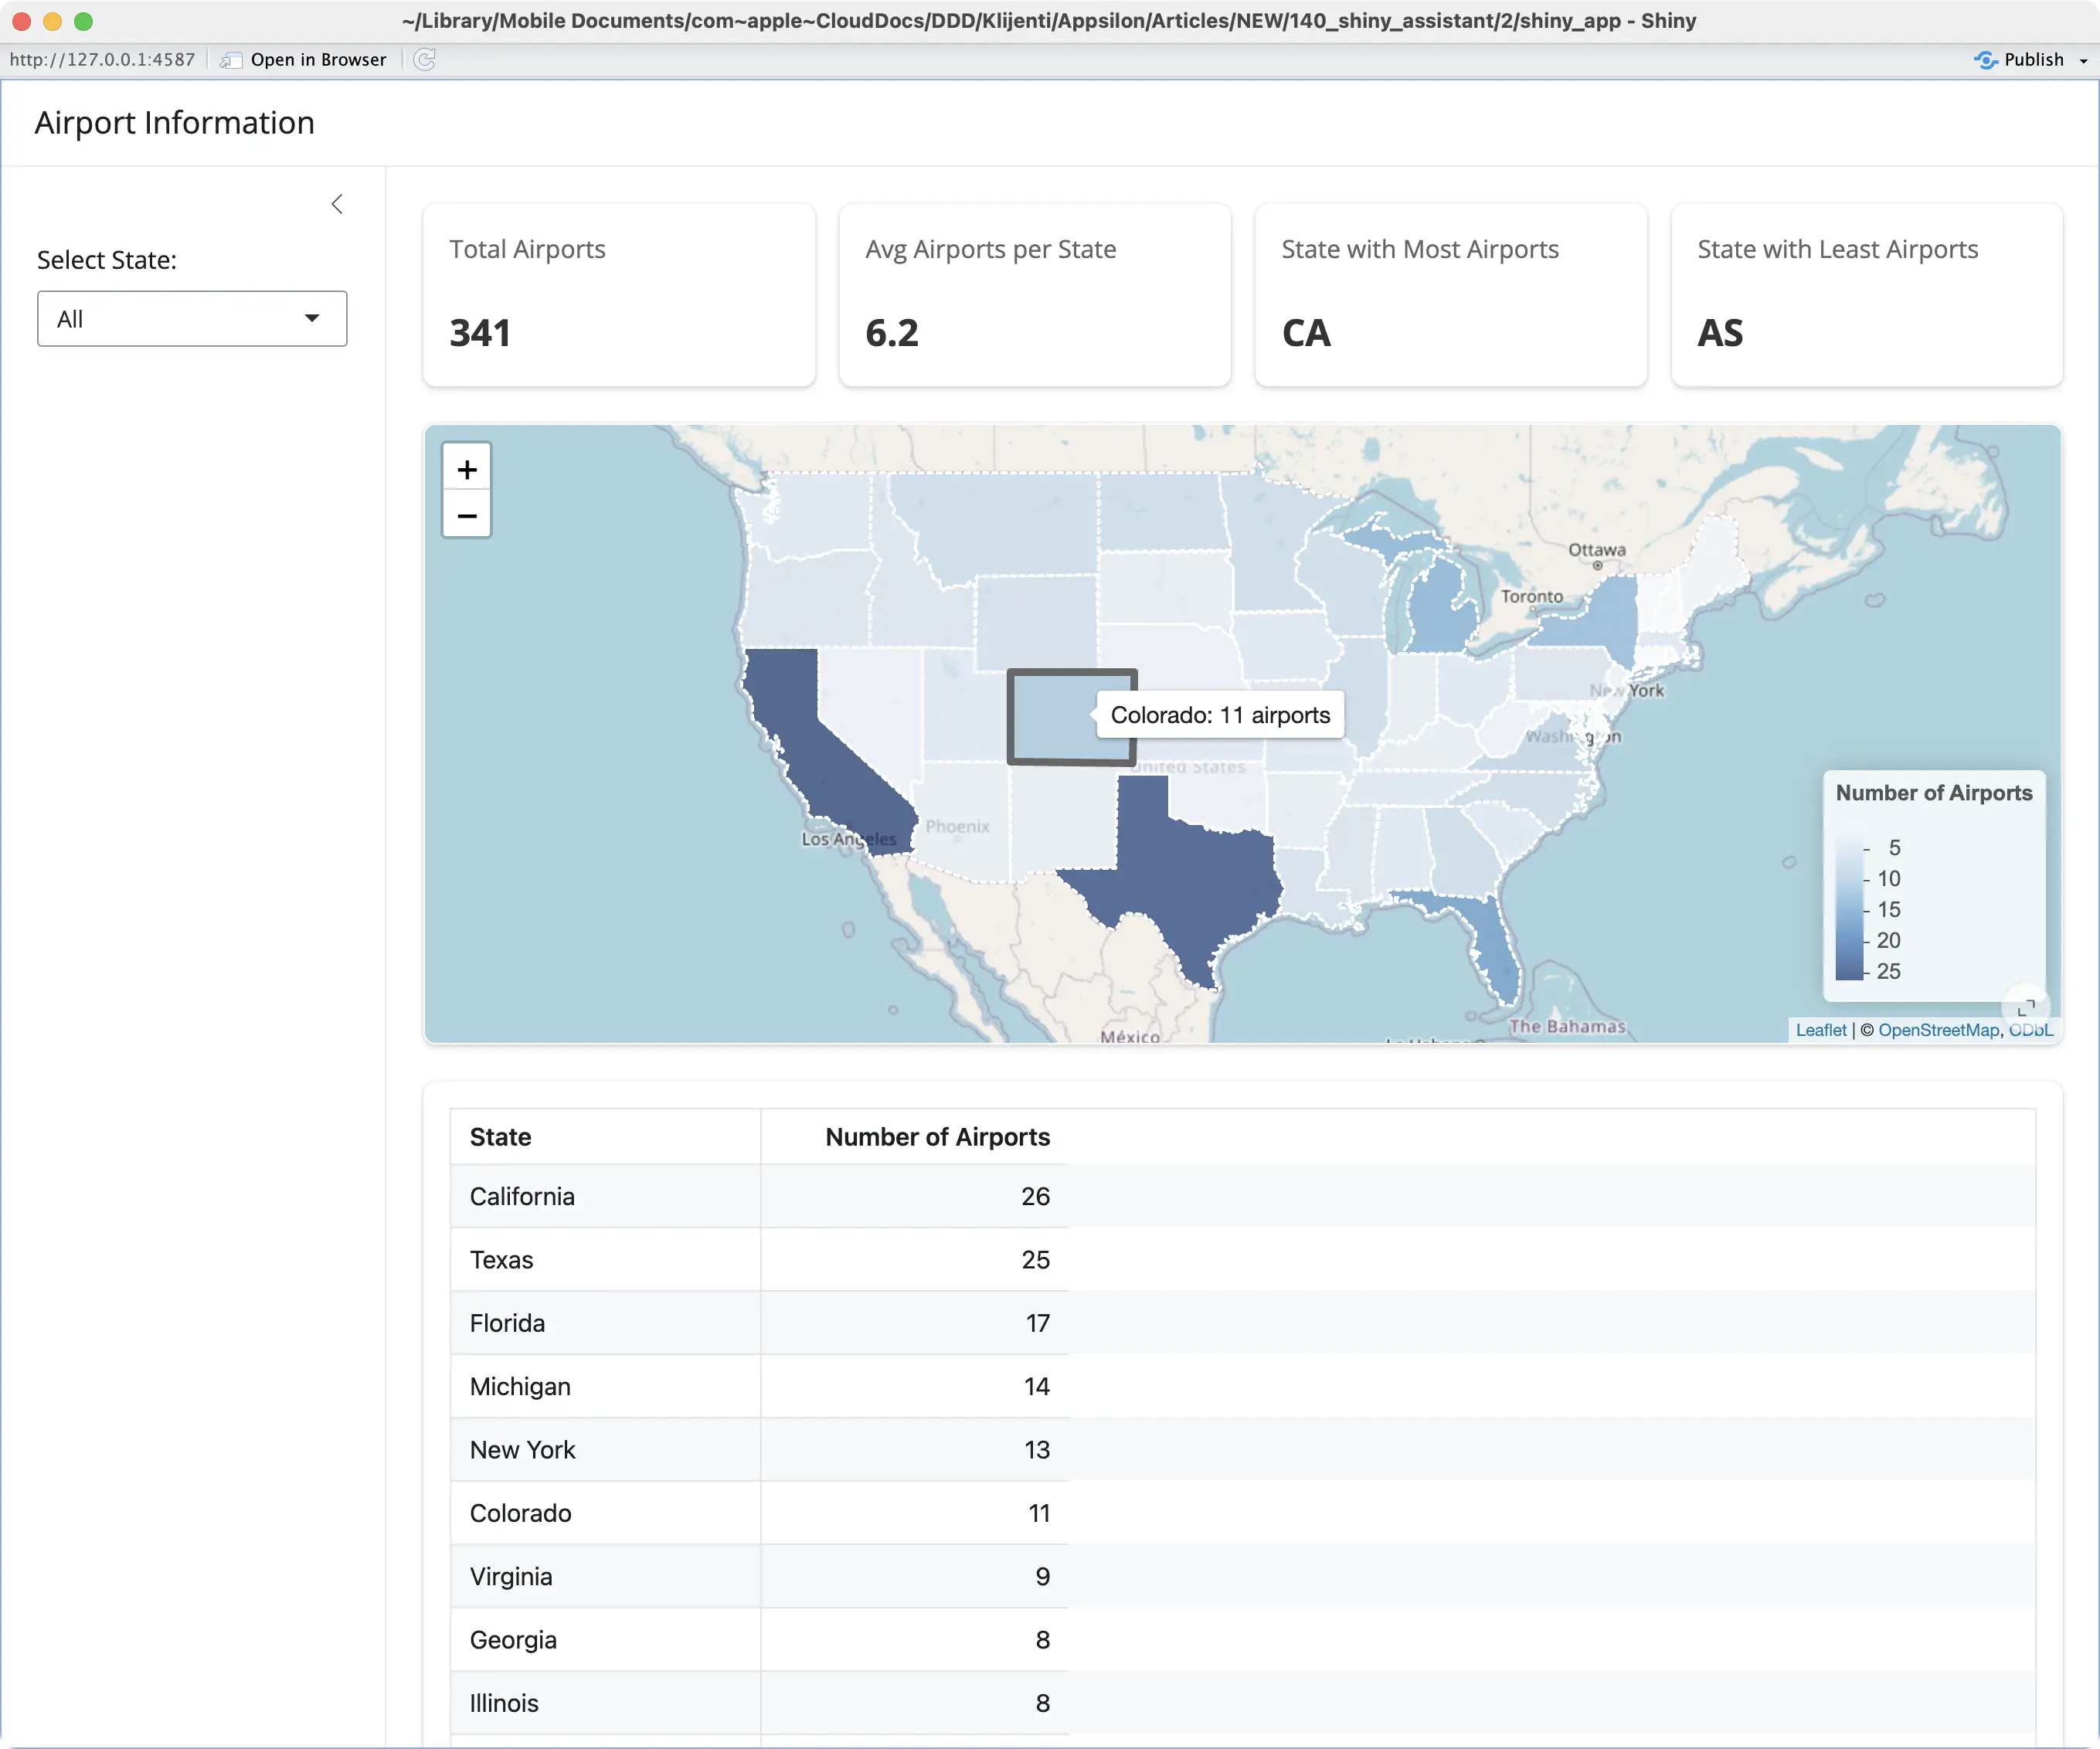
This is what the app looks like after the generated bug fix:
Now the app works as expected.
Prompt #7 - Global Choropleth Map Style Fix
There are still two styling issues that are bothering us.
The map shows the data correctly, but the state name is lowercased, and the user can accidentally scroll in or out of the map with the scroll wheel. The map has +/- controls that are enough to adjust the zoom.
The following prompt should fix both issues:
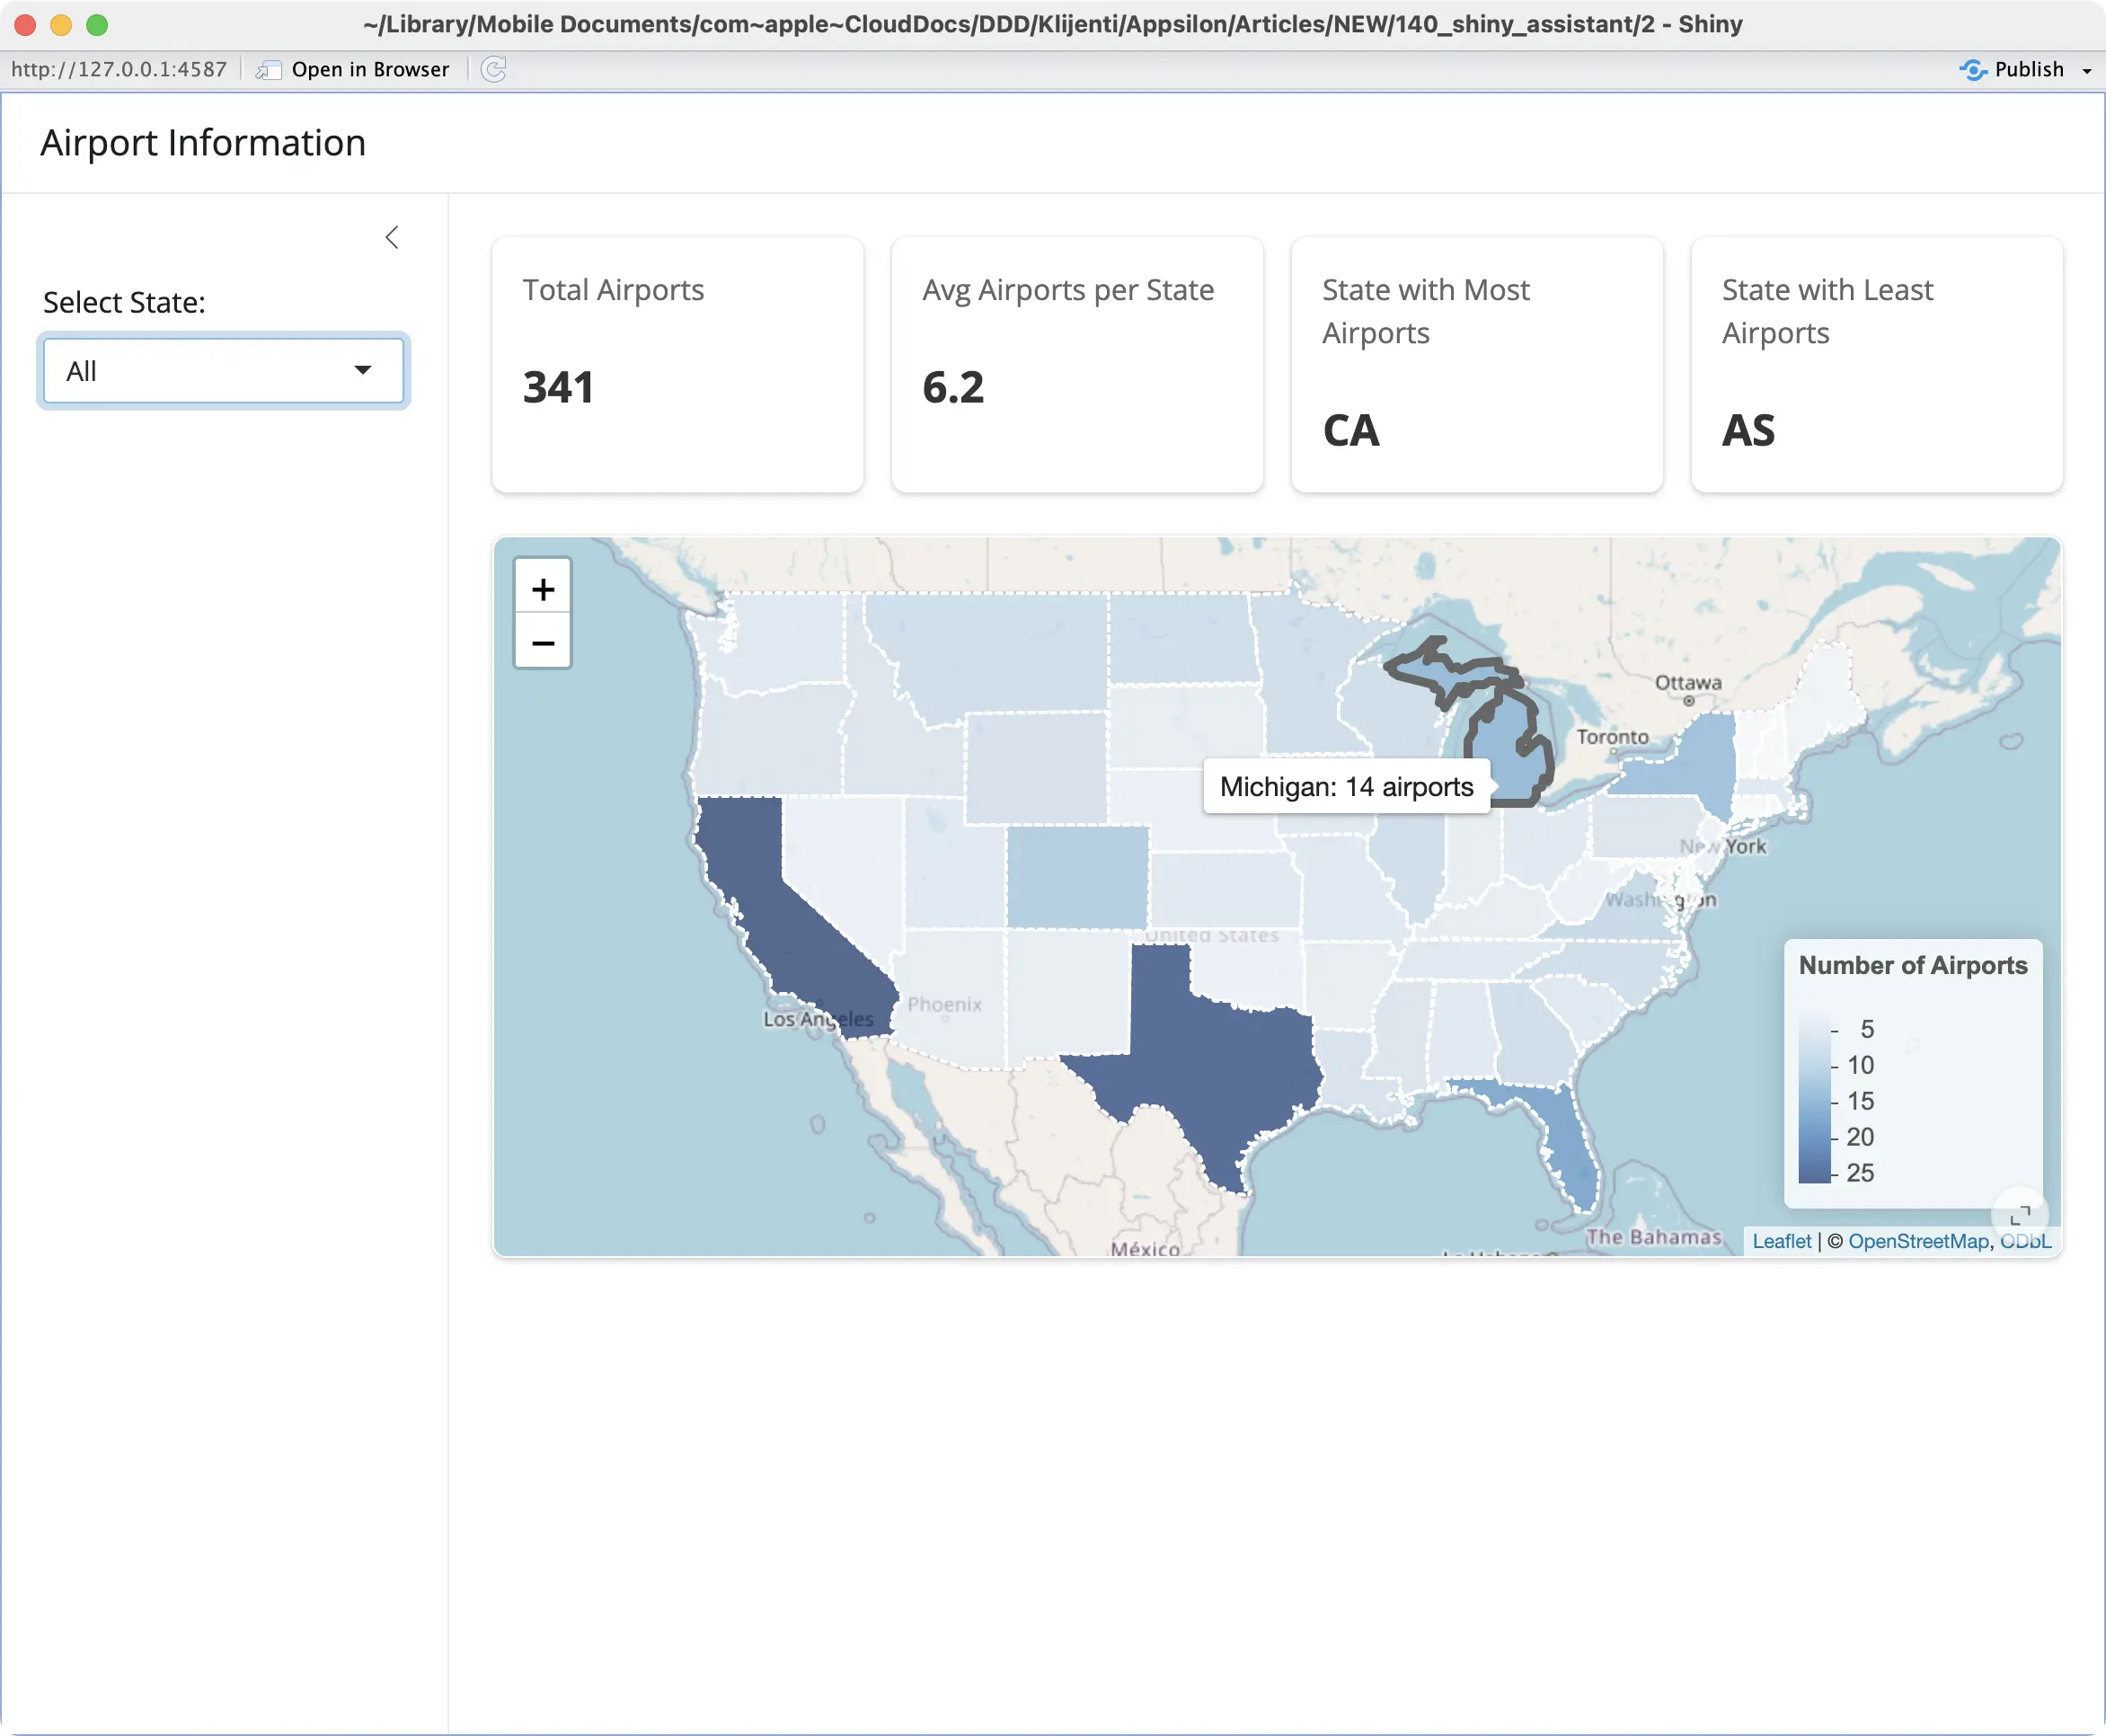
That’s it regarding the map - it displays the data correctly and formats the tooltip just as we wanted.
Let’s move on to the next component.
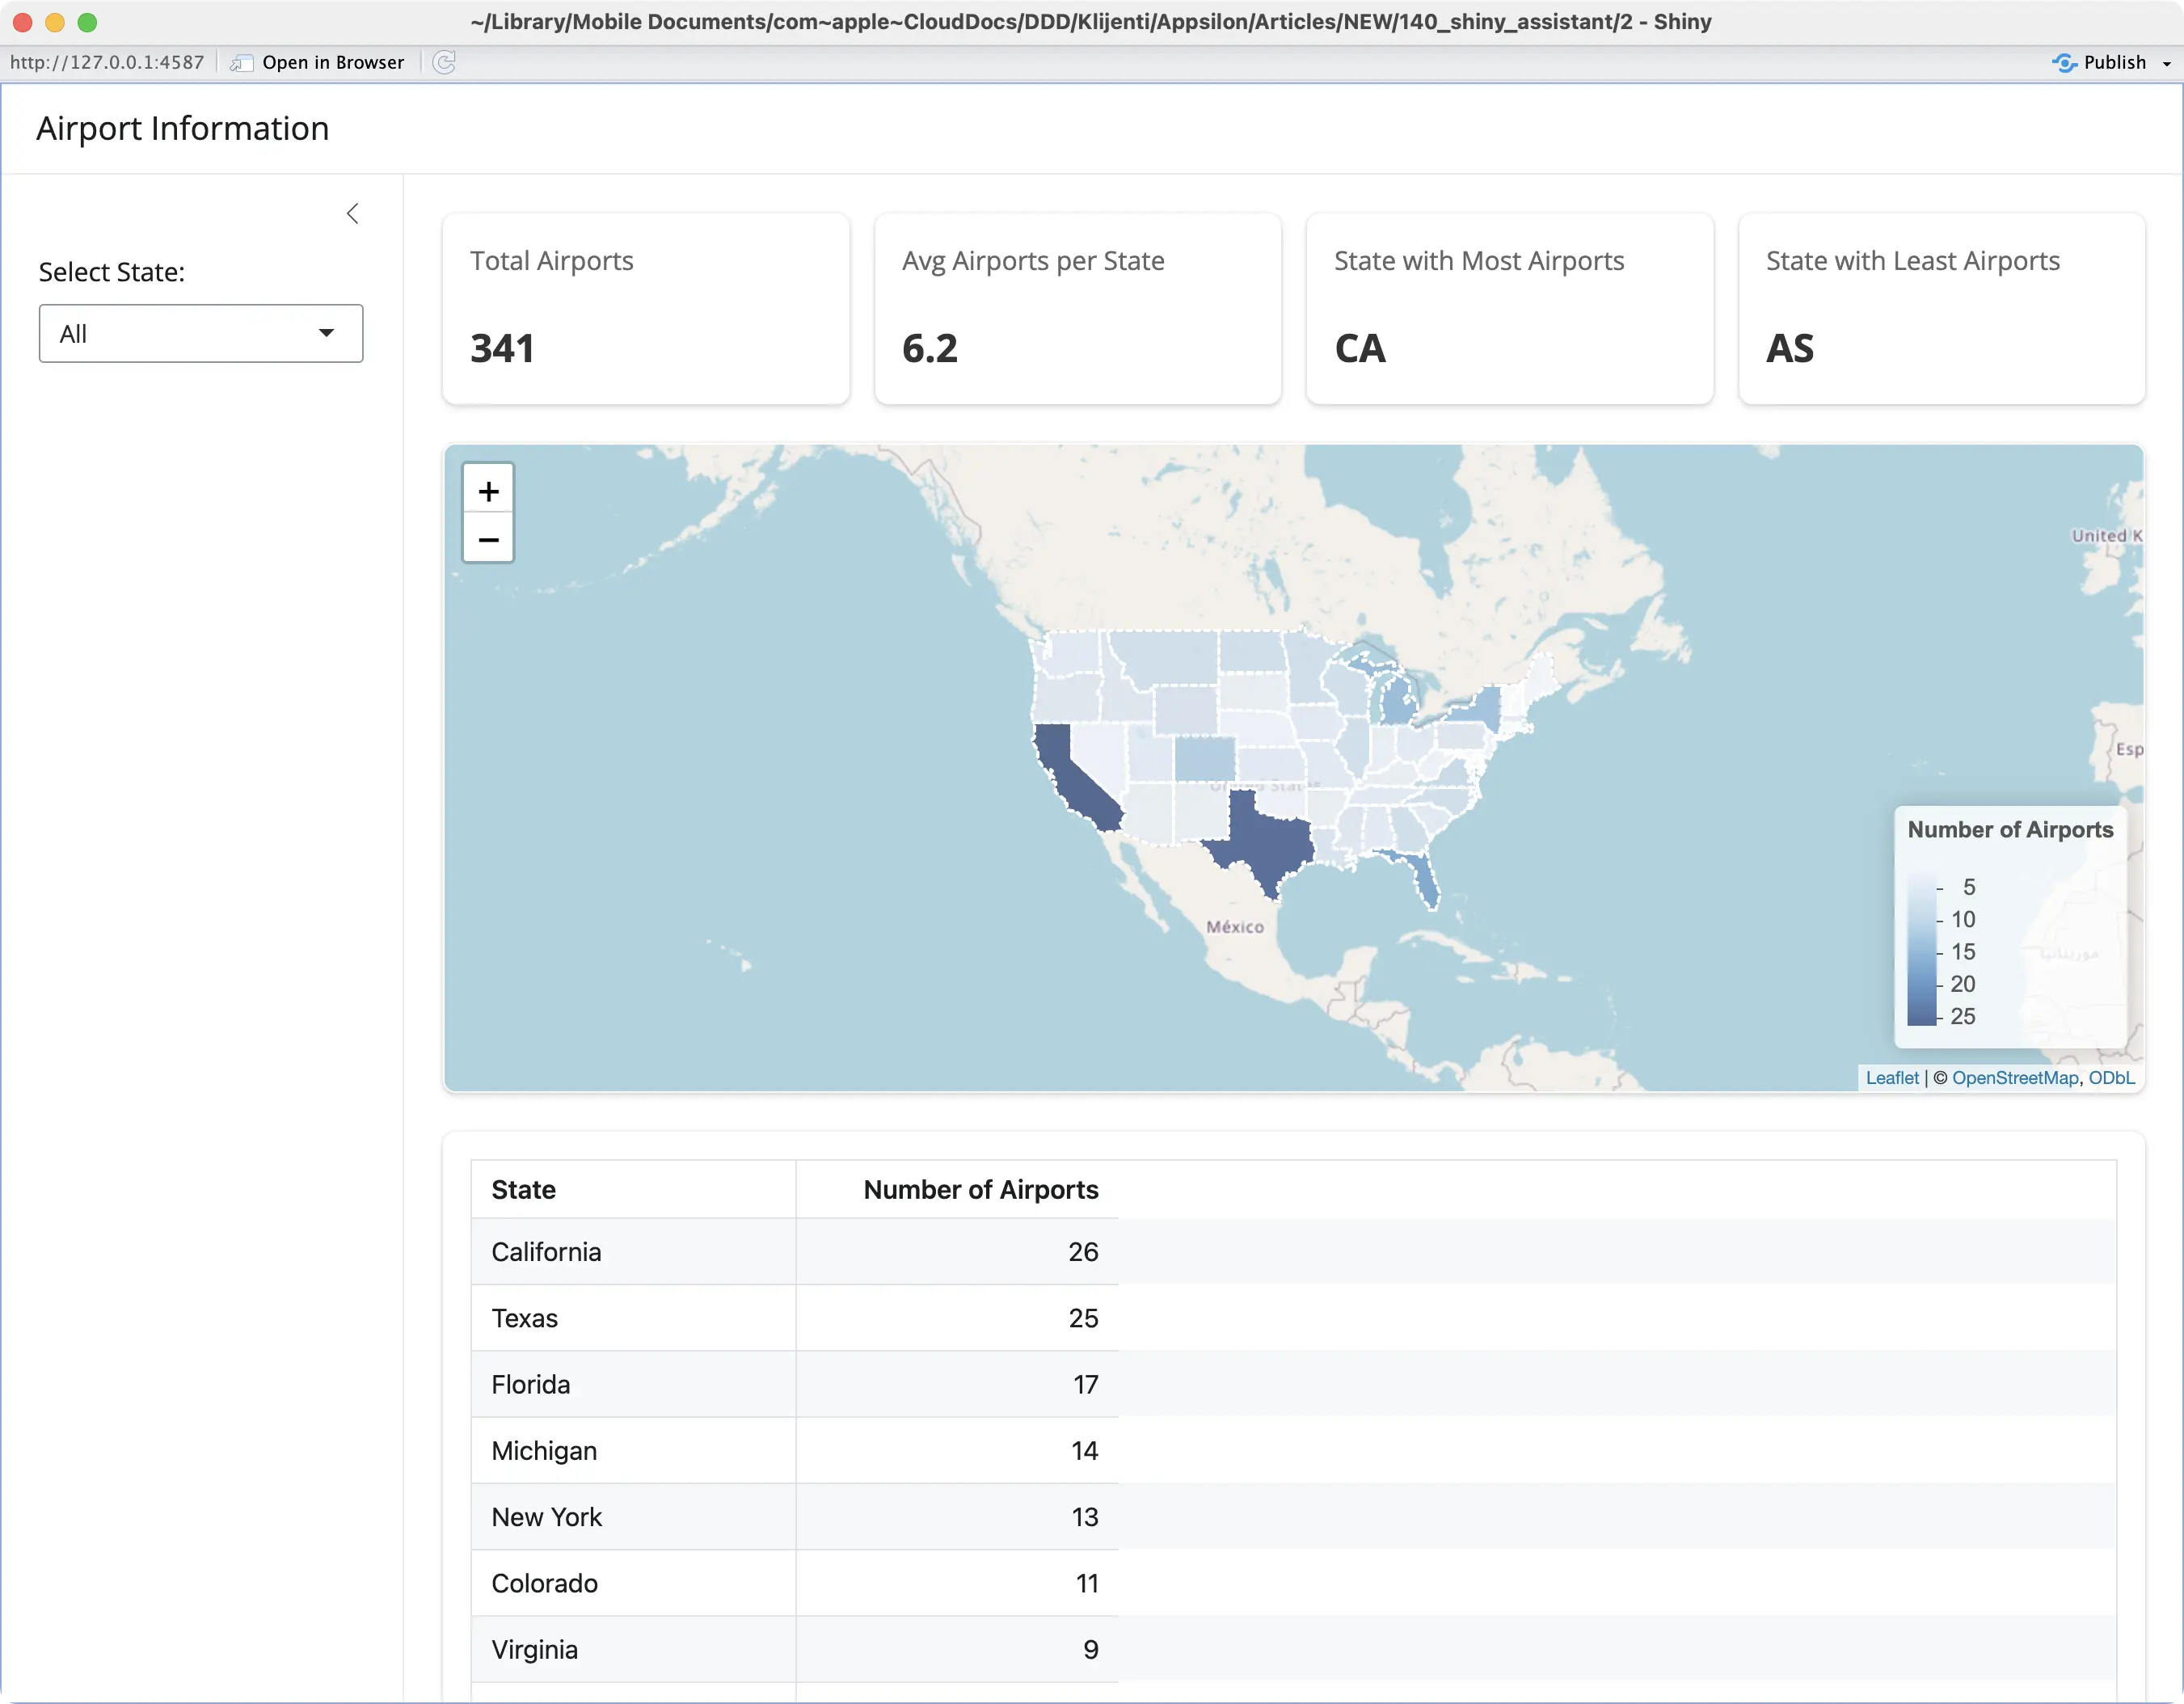
Prompt #8 - Global Table with Reactable
The reactable package in R is used to build interactive tables.
We’ll use only the most basic functionality of the package to show everything shown on the map, but now in a table format.
This table will only be displayed when the user is viewing global airport statistics (dropdown menu set to “All”):

The table with pagination is displayed, but it also includes an unnecessary `glob` column. It’s something we’ll try to remove next.
Prompt #9 - Global Table with Reactable Bug Fix
The following prompt instructs Shiny Assistant to remove the `glob` column, as it’s not needed in the app:
And with that, we’ve finished working on the global airport statistics. From now on, we’ll shift our efforts to state-specific views.
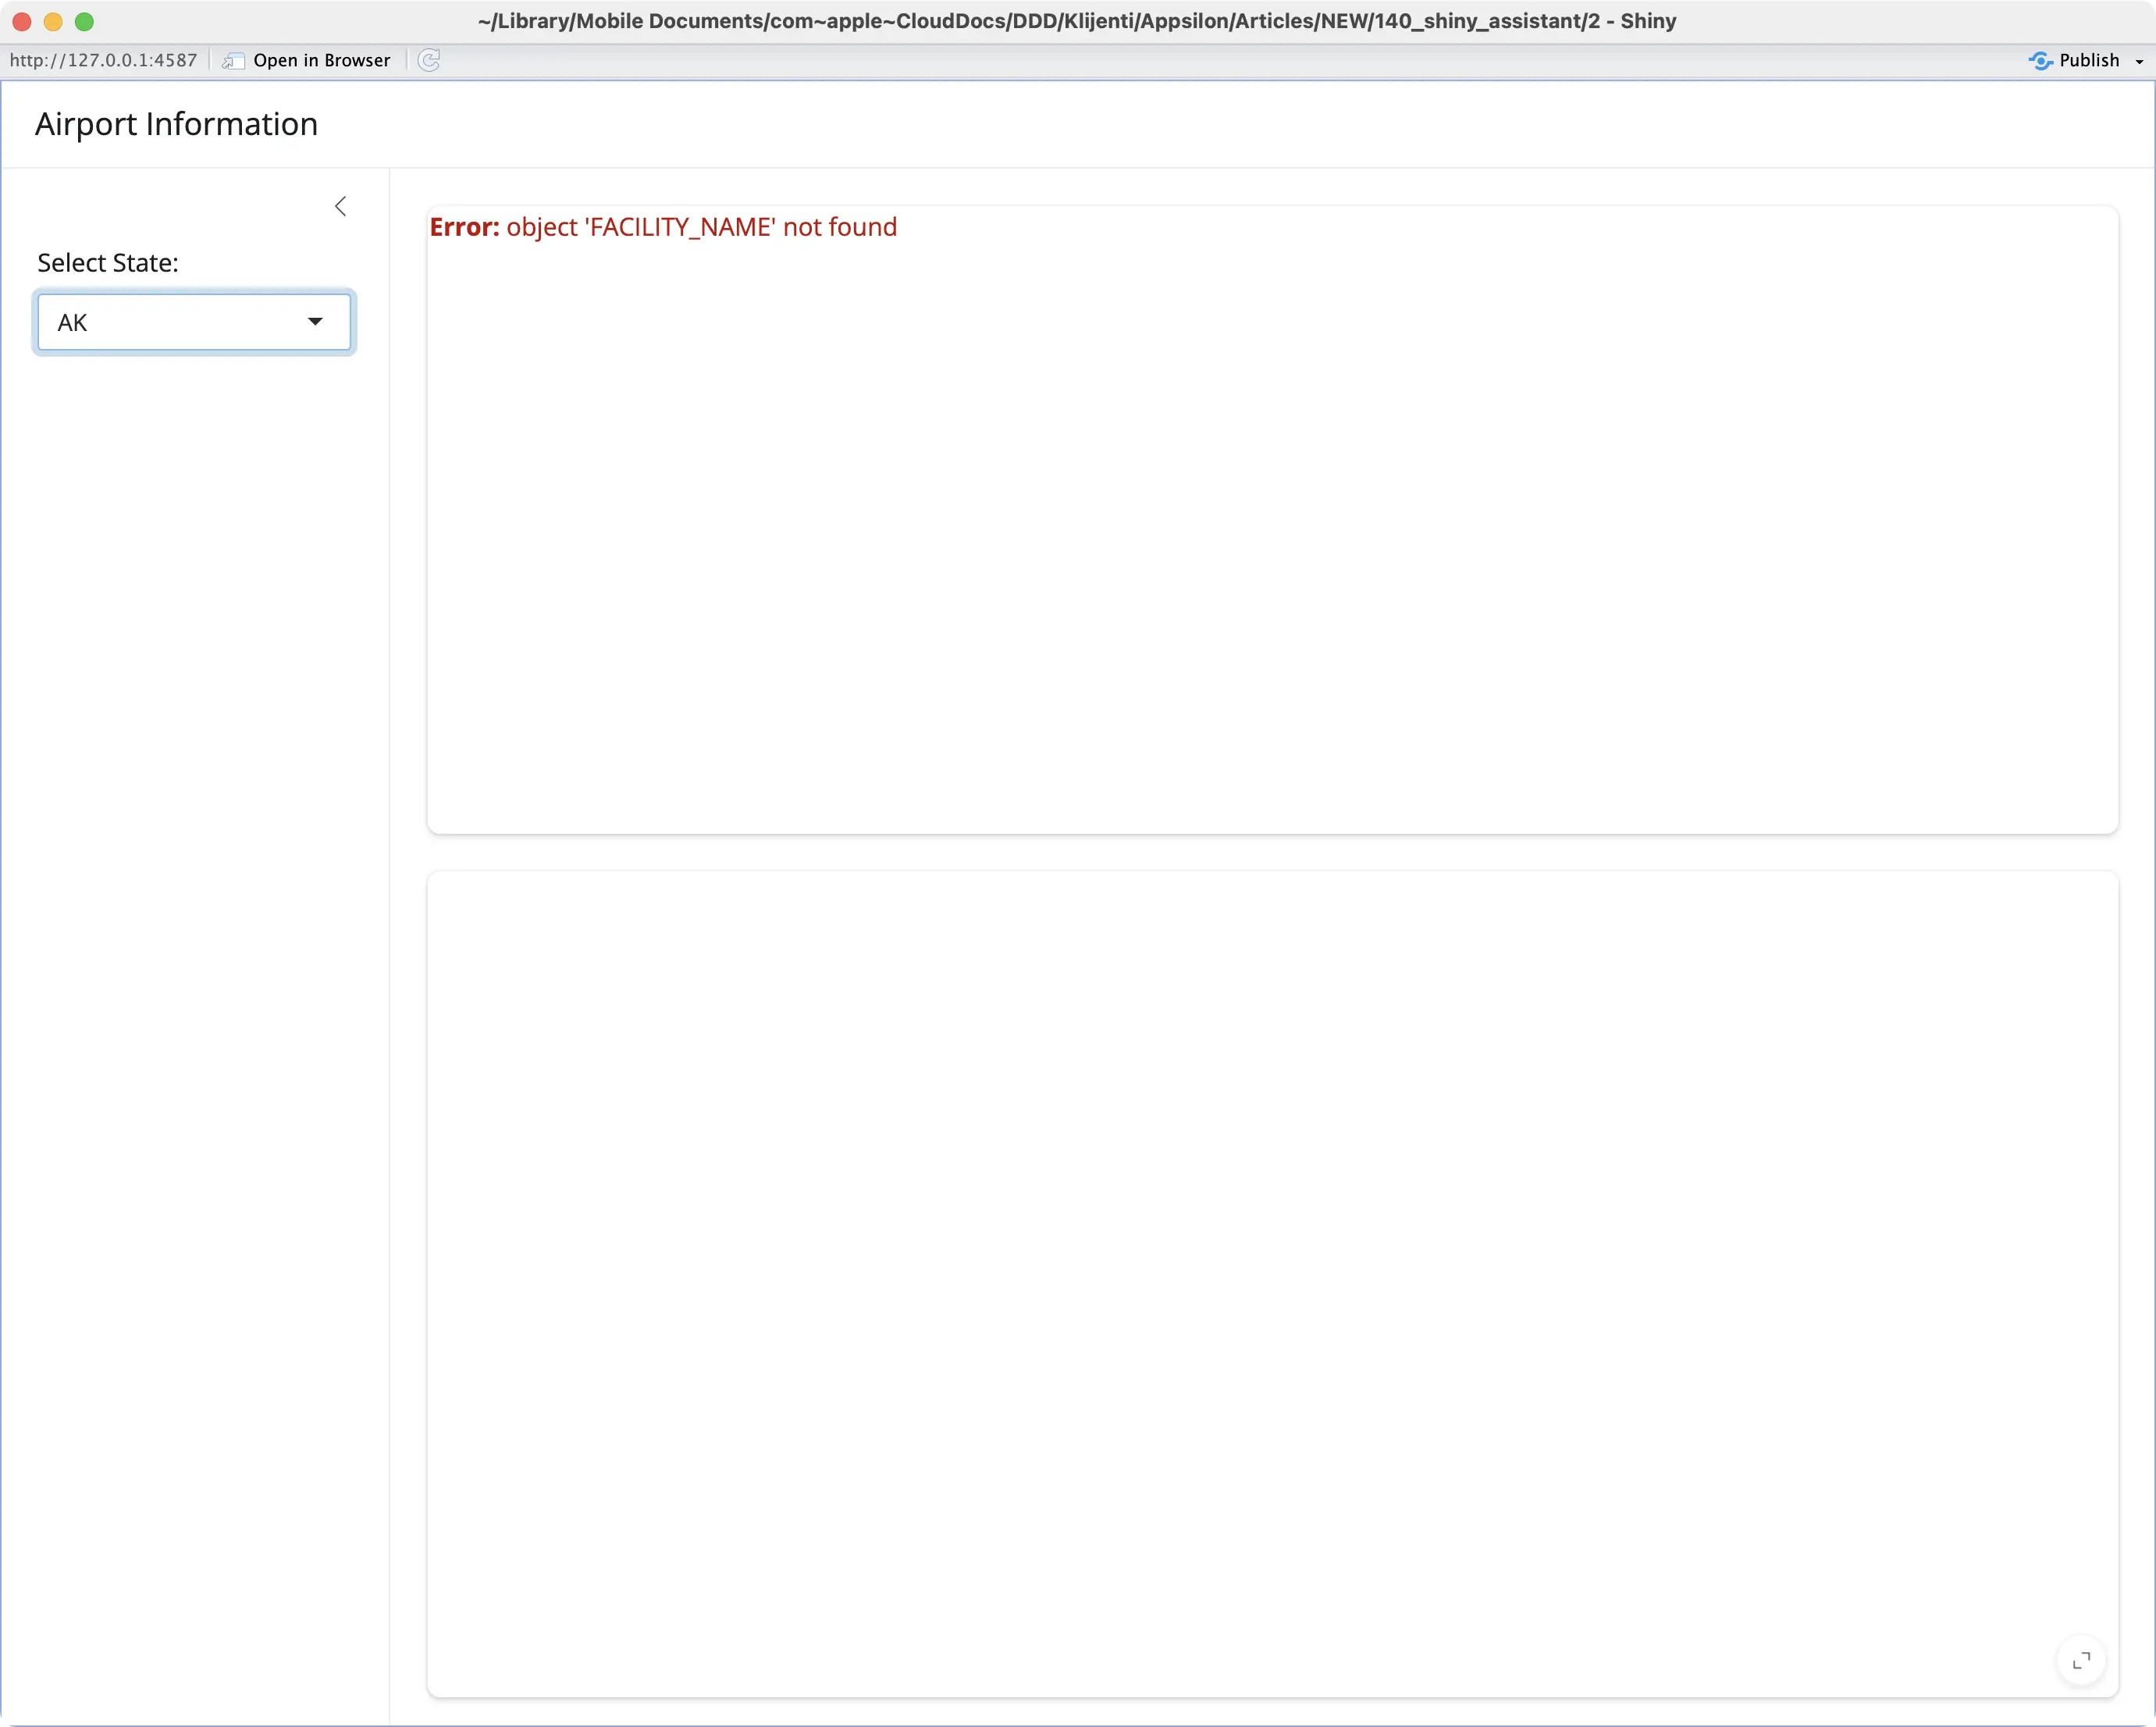
Prompt #10 - State-Specific UI Elements
If you were to select an individual state from the dropdown, you’d see the following output:
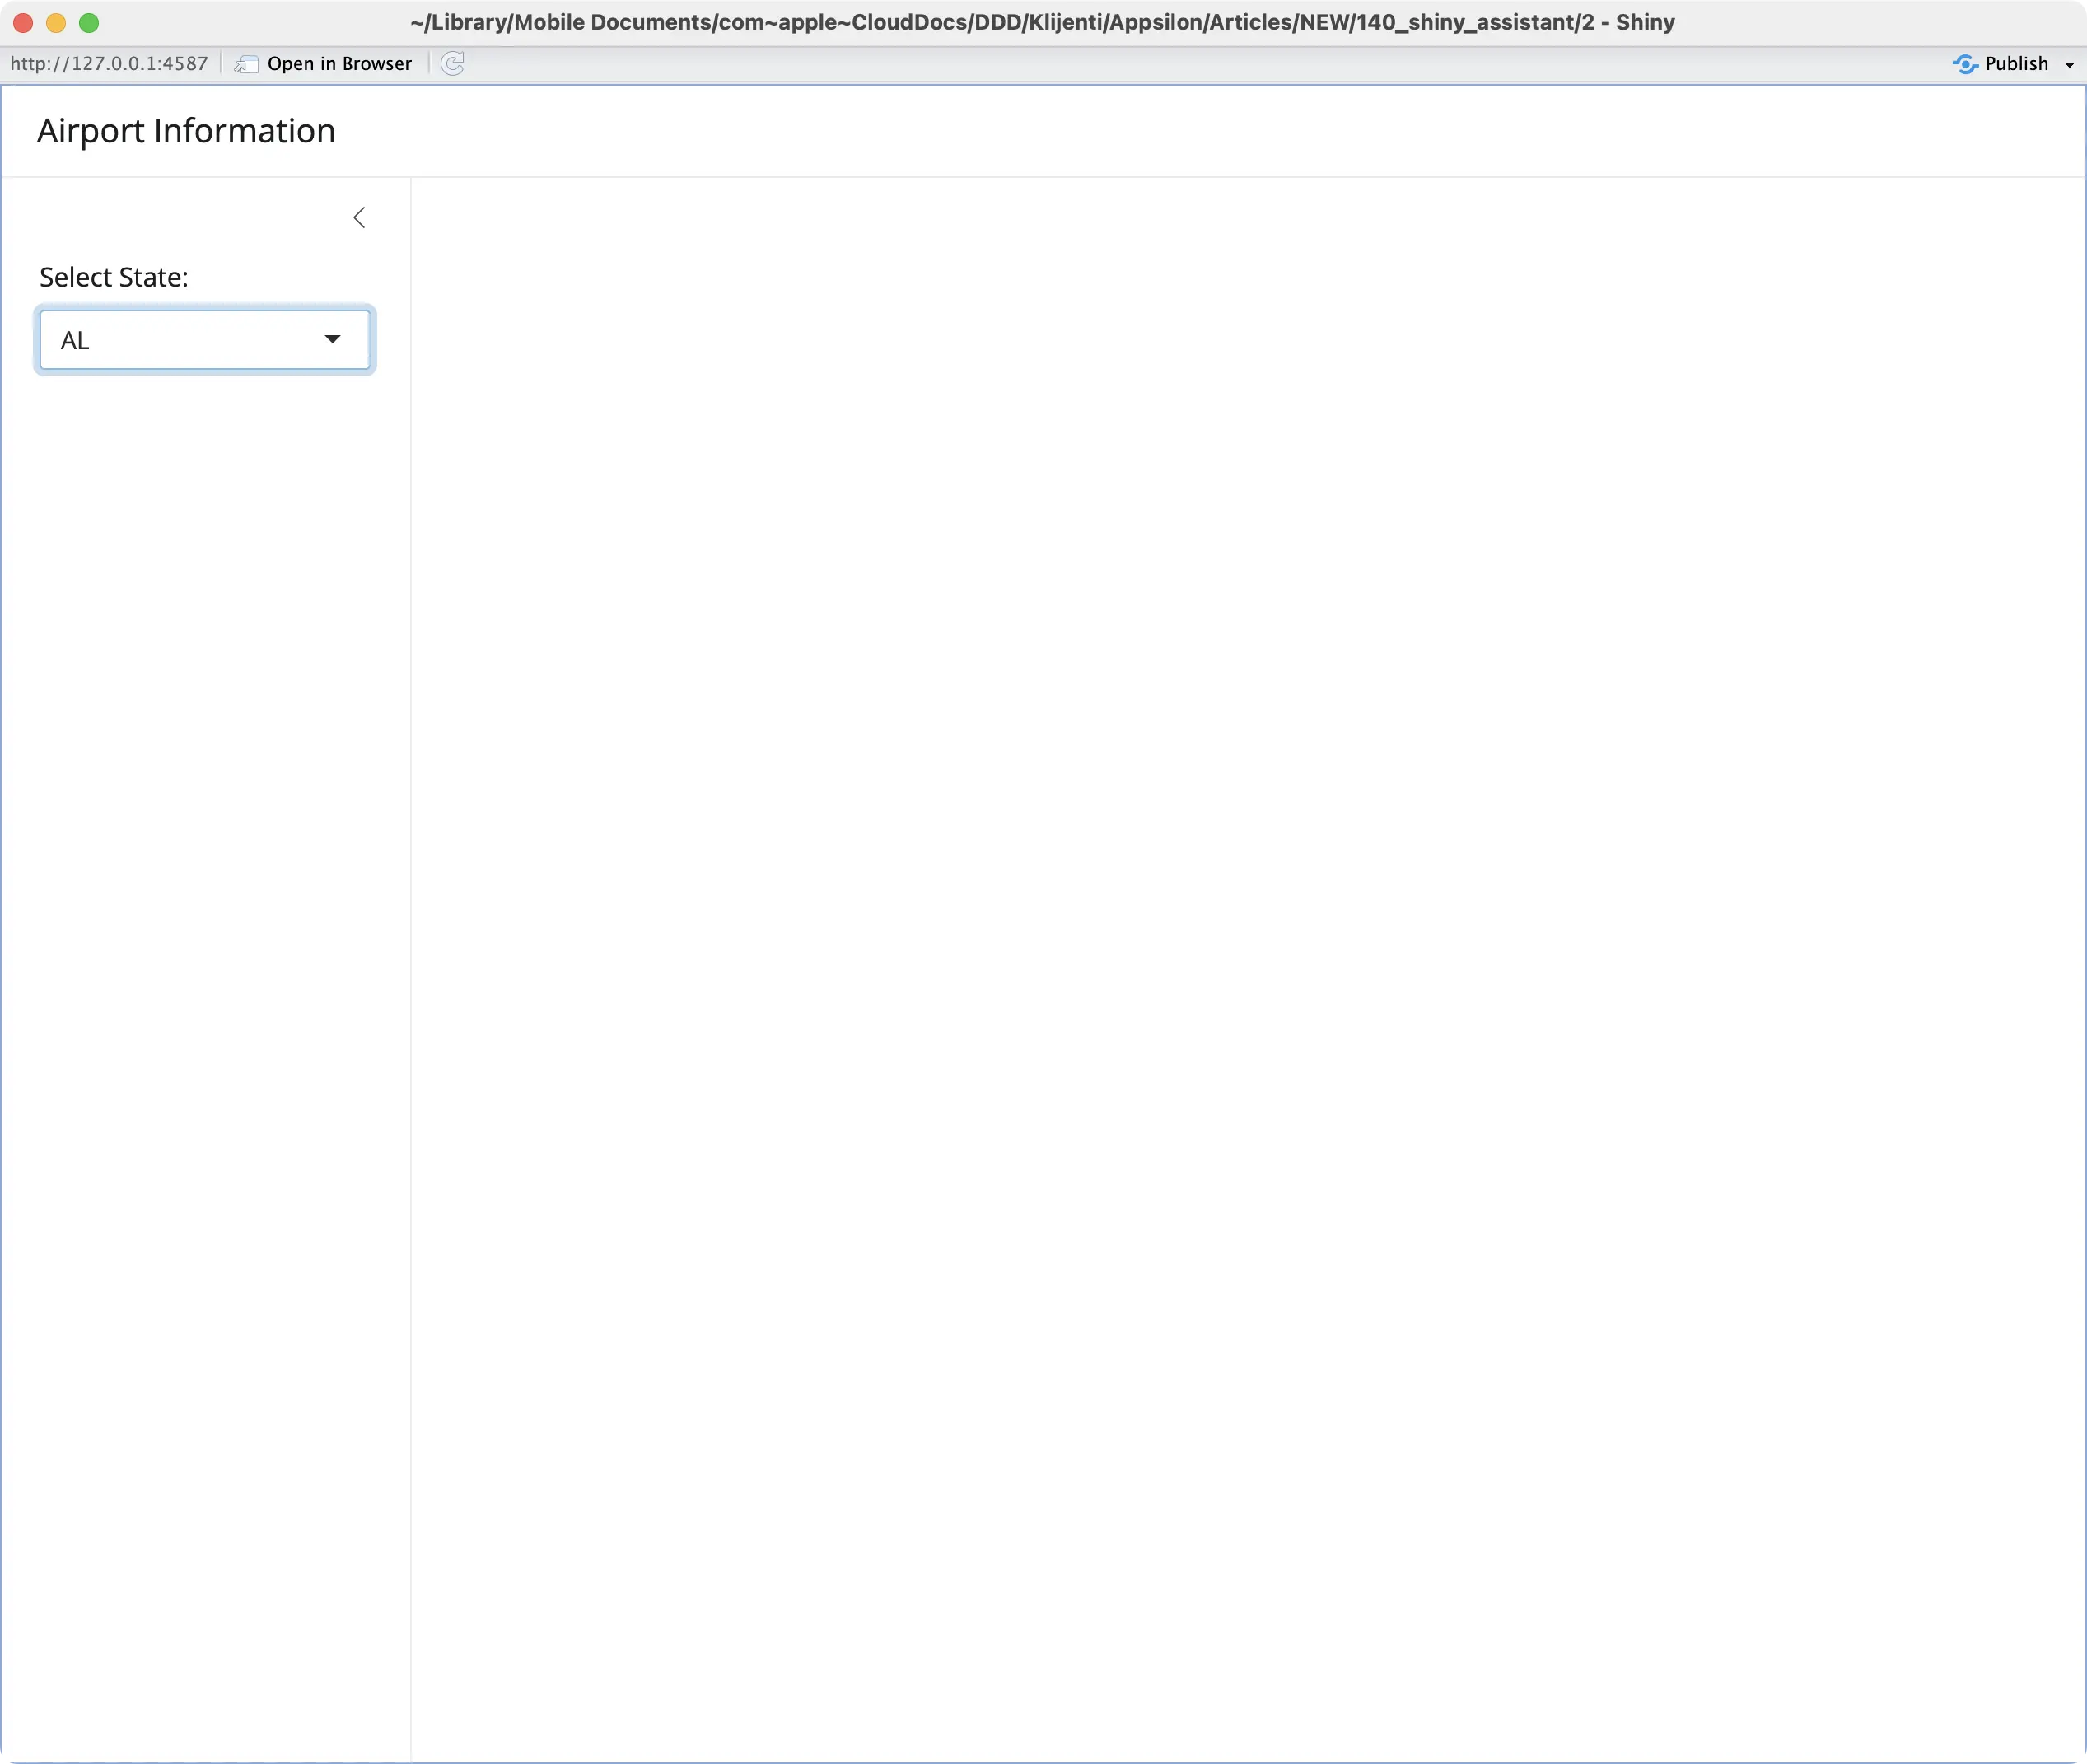
No errors are raised, but no data is displayed either.
The following prompt instructs Shiny Assistant to include a:
- Scatter Map showing a geolocation of all airports in a selected state. More details are displayed on hover (airport code, name, latitude, and longitude)
- Table showing the same information
It looks like we have another error. Hopefully, it’ll be easy to fix since it looks like the app is referencing a data frame column that doesn’t exist.
Prompt #11 - State-Specific UI Elements Bug Fix
Upon further inspection, that was the only error.
It’s a strange one since we explicitly told the Assistant the structure of our data 10 prompts ago (potentially a context limit?), but it’s an easy error to fix.
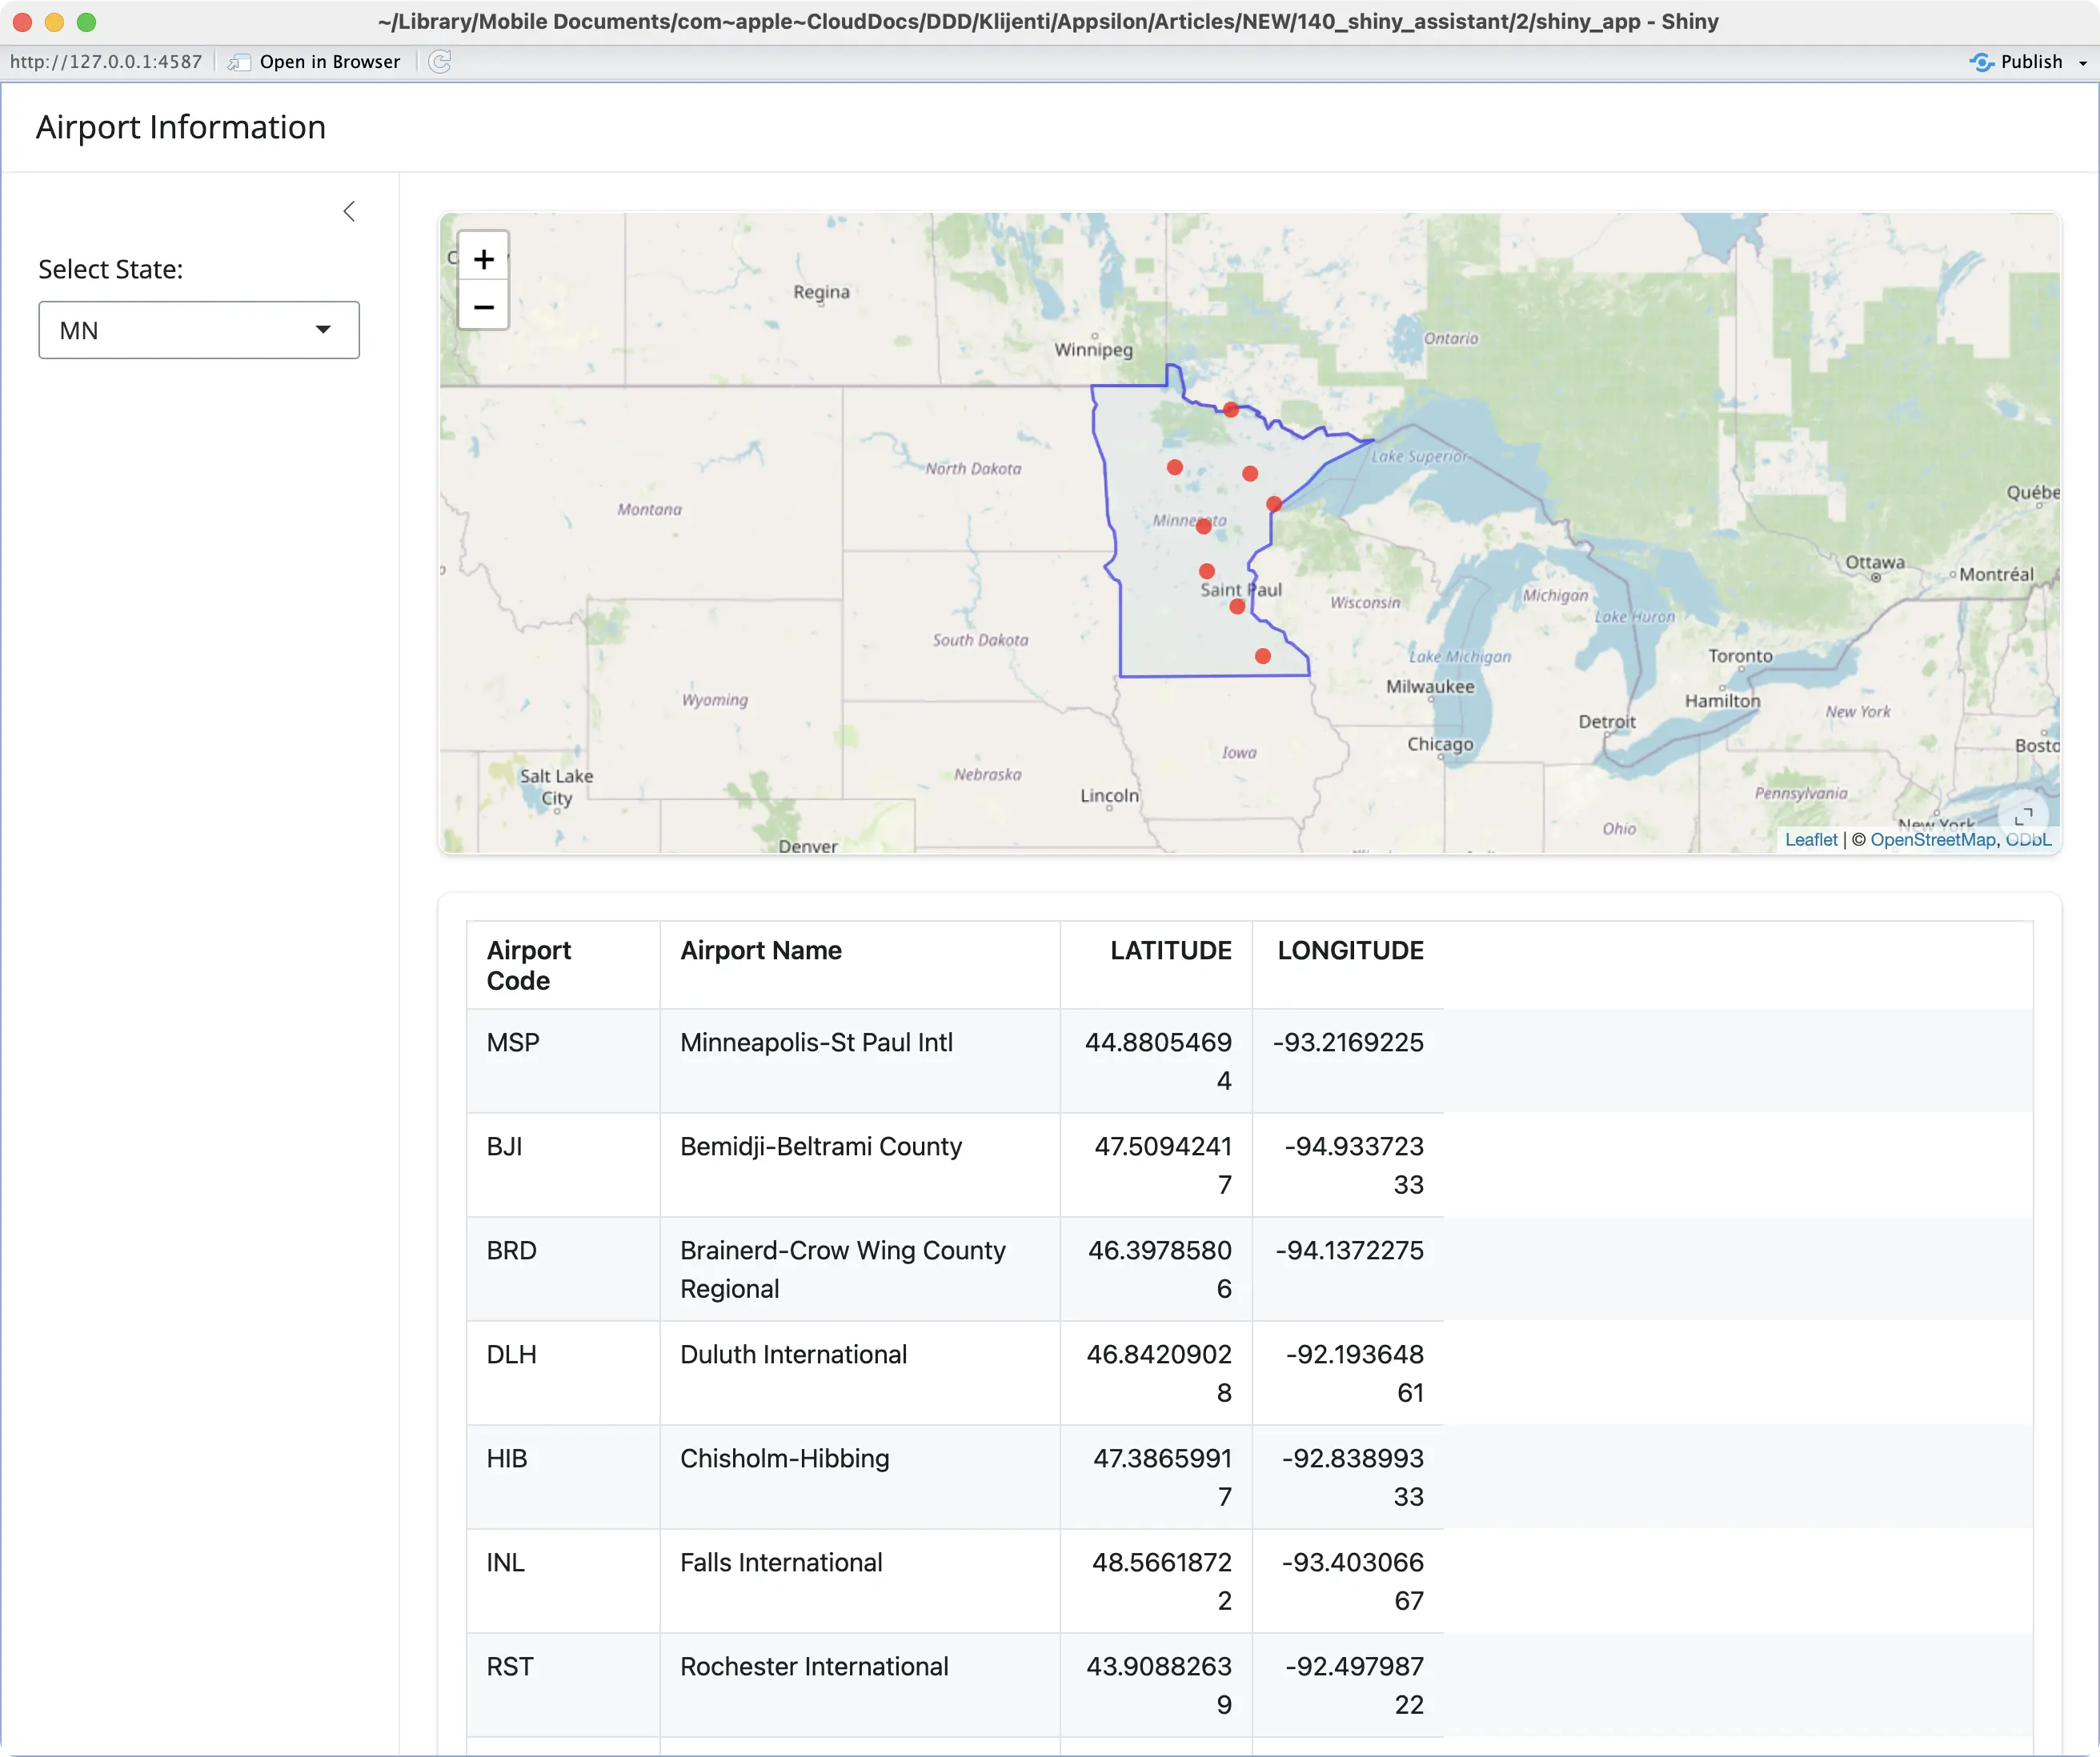
The following prompt shows the Assistant all the column names we have available, and instructs it to fix the issue:
The table could benefit from some stylings, but let’s say we’re satisfied with the results.
The app is now complete! The only problem is that the `app.R` file is a mess of 260 lines of code. In other words, you should reformat the code base before marking your work as done.
Prompt #12 - Better Code Organization with Shiny Modules
Shiny Modules allow you to separate reusable app logic into smaller, more manageable R scripts.
That’s exactly what we want to do next. The following prompt instructs Shiny Assistant to split the logic into multiple files and provide better organization for the app:
After restructuring the Shiny app in the way proposed by Shiny Assistant, we ended up with the following project structure:
It’s much better, maintainability-wise.
It’s also worth noting that Shiny Assistant forgot to set the working directory in `app.R`, which means the module imports won’t work out of the box. But that’s an easy fix.
After running the app, it seems like the global statistics work as before:
But things go south if you try to view state-specific airport statistics:
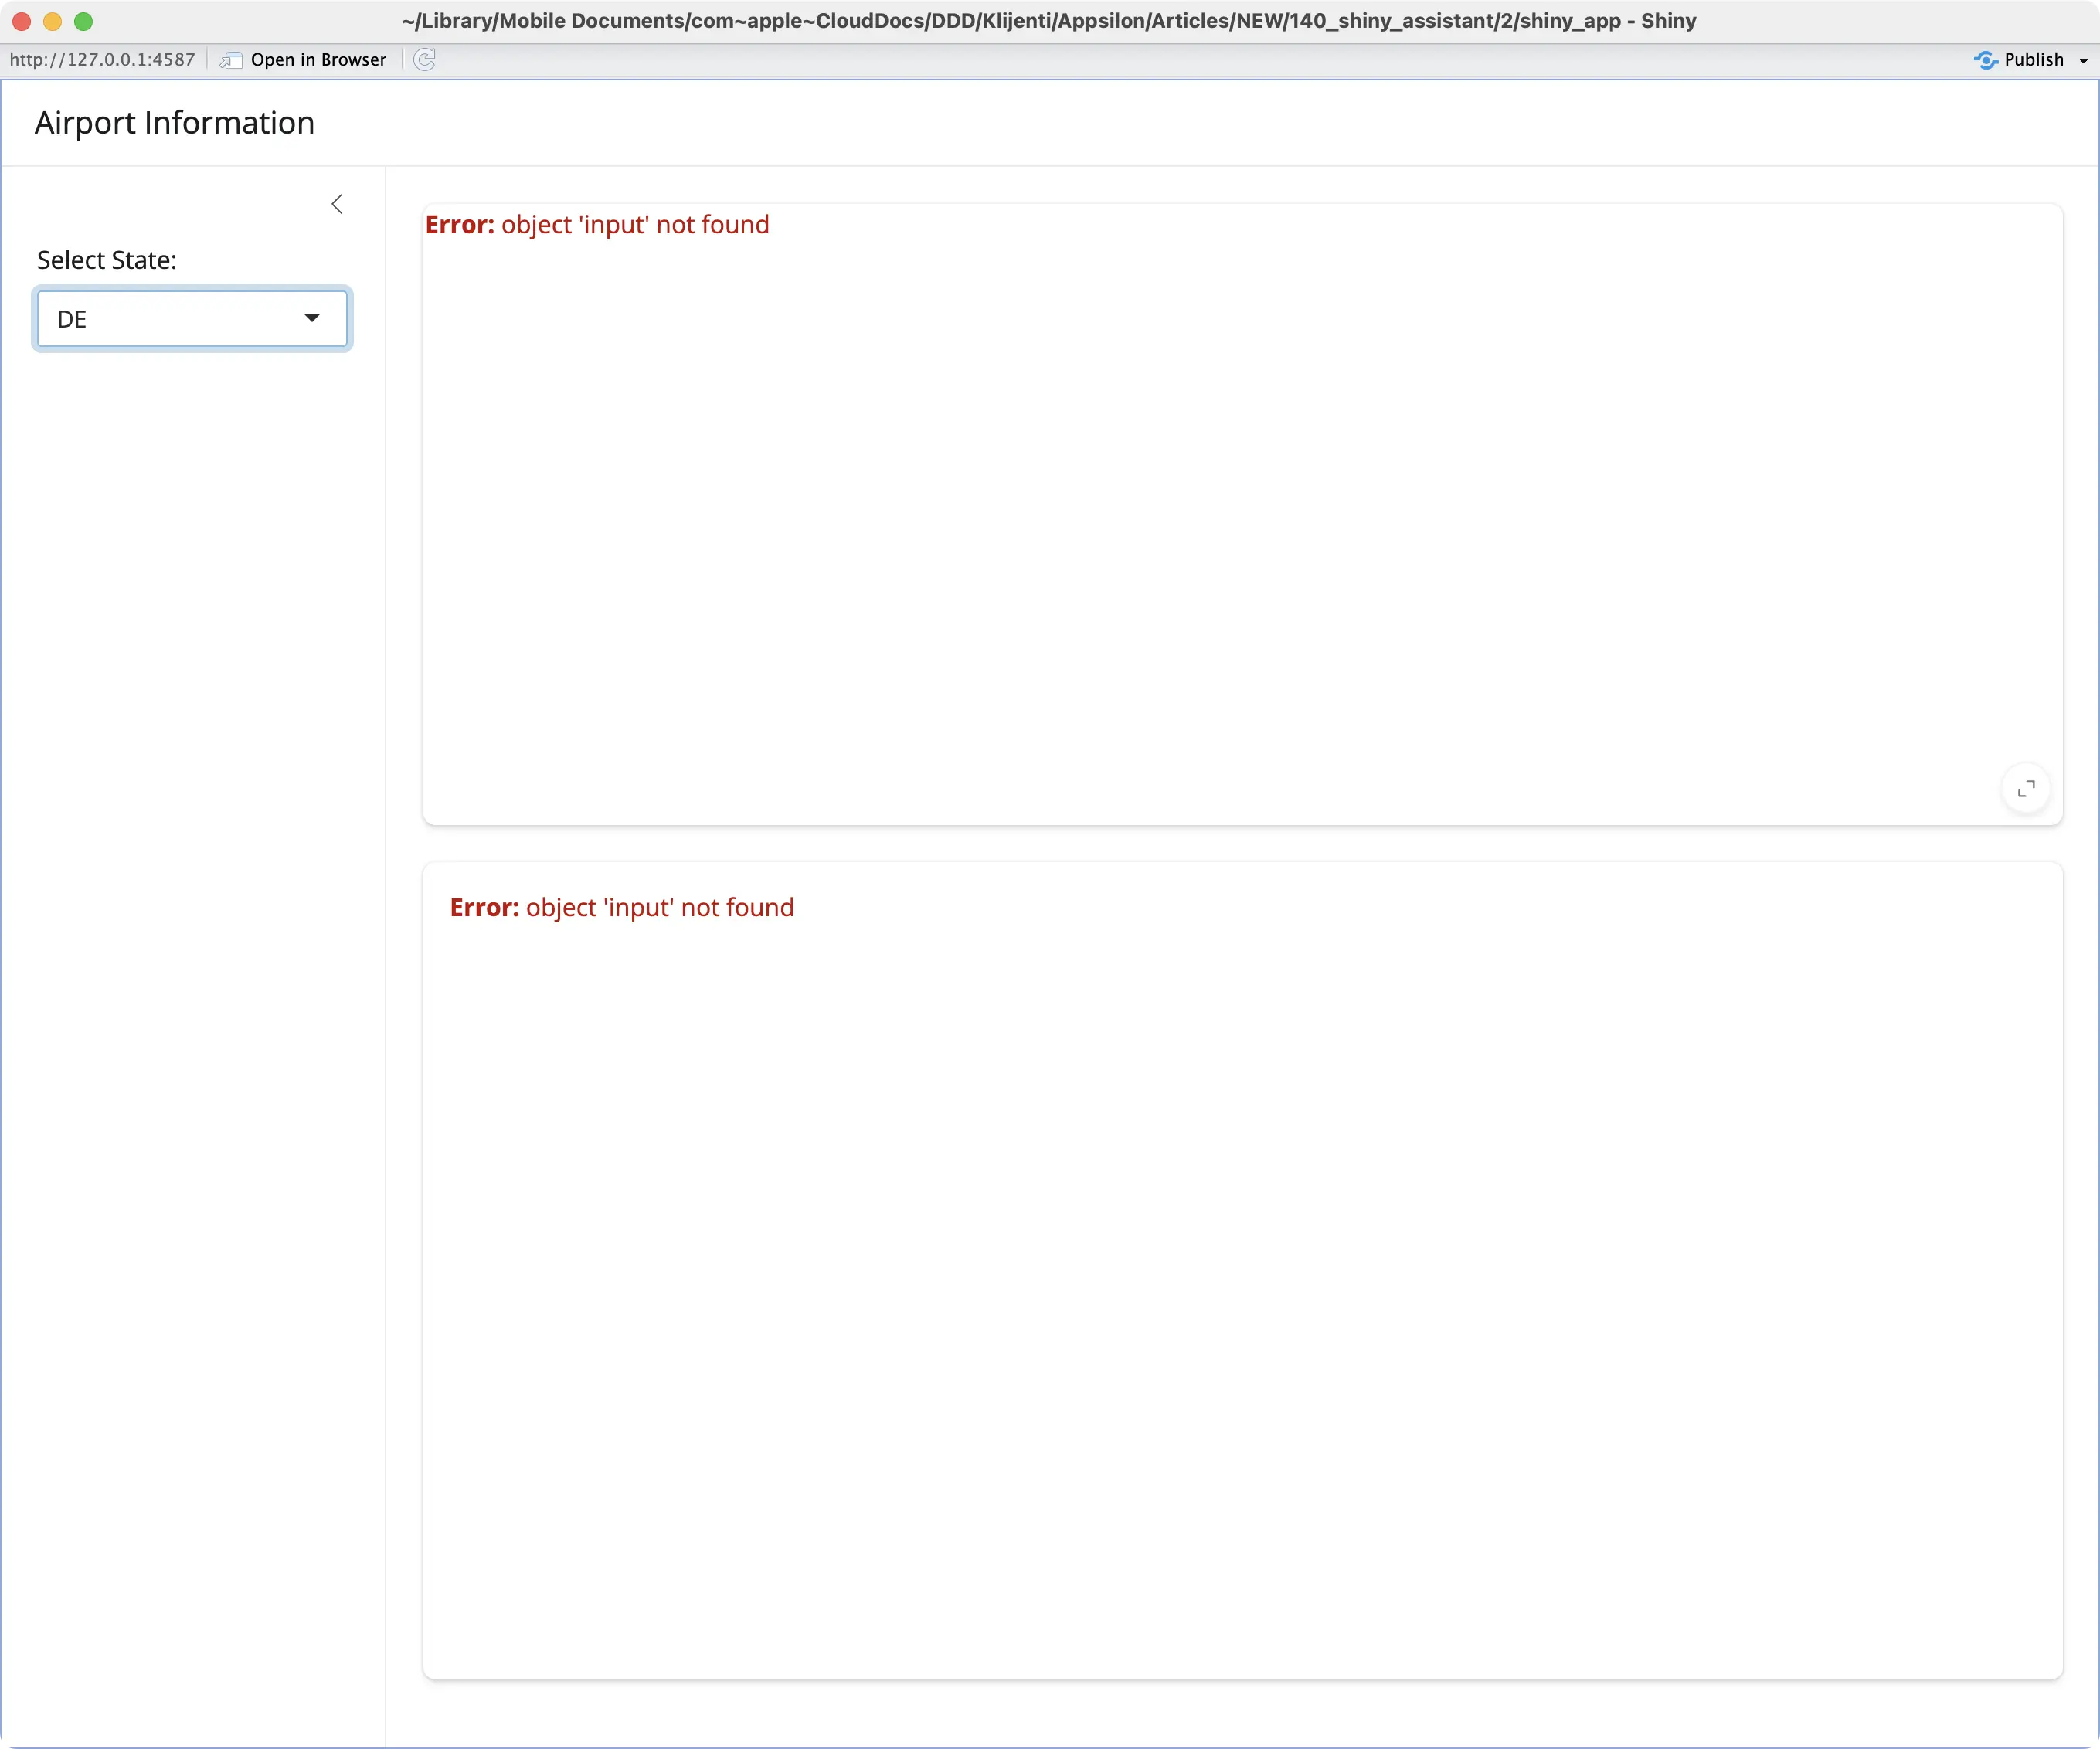
It’s time for another round of bux fixes!
Prompt #13 - Better Code Organization with Shiny Modules Bug Fix
The error message printed to the R console wasn’t super specific, but it pointed to the `data_module.R` file.
It was enough for Shiny Assistant to figure out what was the mistake and to rewrite the code in `data_module.R` and `app.R`:
The app is now working exactly as it did before modularization, so we can consider our work done.
Prompt #14 - Unit Tests
The last prompt for today has to do with unit tests.
We don’t want to write them manually, and instead, would like for Shiny Assistant to come up with test cases for every Shiny module.
This is the prompt we gave it:
And after including tests in our app, the project folder structure looked like the following:
Shiny Assistant used the `testthat` package to write a series of tests.
It also gave us instructions on how to run the tests:

After unit testing has finished, you can see that some test cases passed and some failed:
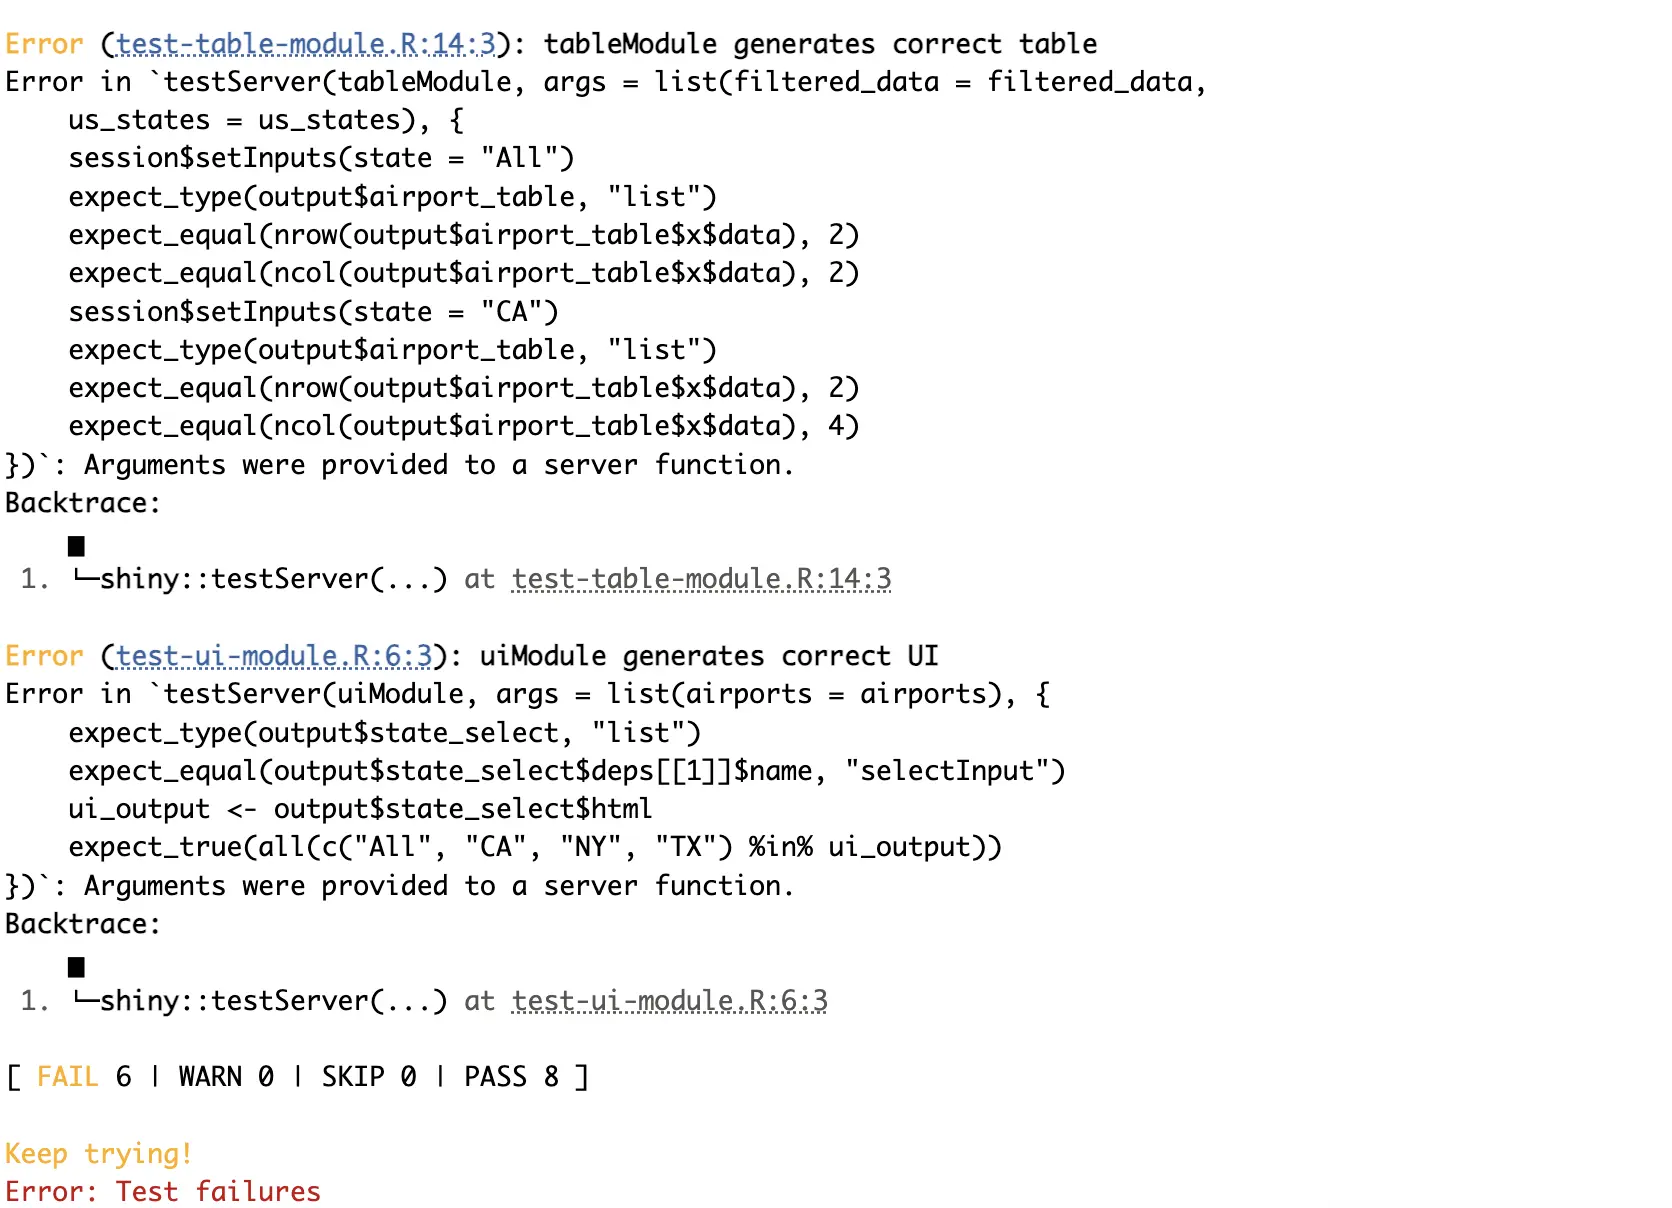
But that has less to do with Shiny Assistant capabilities and more with the open and unspecific nature of our prompt.
We’re still quite satisfied with the results. Unit testing isn’t specific to R Shiny, but the Assistant still has no trouble showing us how to test a modularized Shiny application.
Shiny Application Source Code
This section contains the source code for the finished and modularized version of the app generated by Shiny Assistant.
You can copy this code and use it as-is. The only thing you need to tweak is the working directory. We’ve deliberately left the code in the original format, so you can see firsthand if the chosen Shiny Assistant code formatting styles match yours.
www/custom.css
modules/data_module.R
modules/map_module.R
modules/stats_module.R
modules/table_module.R
modules/ui_module.R
app.R
Is Shiny Assistant Worth Your Time? Pros and Cons
After that behemoth of a section, what are our final thoughts on the beta version of Shiny Assistant?
We’ll give you an answer through a list of pros and cons. We’ll further split the cons to explain what’s specific to Shiny Assistant, and what ties more to Generative AI itself.
Shiny Assistant Pros
Shiny Assistant is an amazing tool that can help both beginner and seasoned Shiny developers. Here are the things we particularly loved about it:
- It’s free - Yup, it knows as much about Shiny as the developers behind it, but won’t cost you a dime. You can add your Anthropic API key which will cost you on a per-request basis, but the tool itself is free of charge (at least as of September 2024).
- It supports both R and Python - Shiny Assistant can build Shiny apps in R and Python. We haven’t covered the latter in today’s article, but plan to do so in the future. It will be interesting to compare the two since R’s version of Shiny has been around the block for approximately 10 years longer.
- It supports a wider R Shiny ecosystem - This pro is possibly limited to R Shiny, but nevertheless, the Assistant knows how to work with packages frequently used with Shiny, such as Shiny Modules, Rhino, R6, and so on.
- It reduces friction in building Shiny apps - The Assistant can’t do everything for you, but if you have some fundamental knowledge it can do most of the heavy lifting. In our example, it’s clear that we’re holding the Assistant by hand most of the time as we know exactly what we want. When our prompts were more open to interpretation, so were the results. Overall, if you have a general idea of what you want to accomplish, Shiny Assistant can create it, fast.
- It increases your learning speed - You can leverage Shiny Assistant to learn new concepts and packages in a non-conventional way. Instead of going through package documentation, simply ask the Assistant to show you how to incorporate the needed functionality. You learn faster and develop faster - win-win!
- Great for creating starter code - We found Shiny Assistant to be great for getting you 70% to the goal. The remaining 30% boils down to fixing bugs the Assistant can’t solve and fine-tuning and polishing application aspects that are faster to implement by hand.
- Less Googling - R is a widely used language, but it still has a smaller community than Python or JavaScript. Googling R or R Shiny errors might not always result in a solution you can use out of the box. Shiny Assistant can fix most of the bugs, saving you time manually searching and custom tailoring a solution.
Generative AI Cons
Some aspects of Shiny Assistant rub us wrong and they have nothing to do with the tool. They are generic downsides to using Generative AI:
- It shortens your attention span - If AI can write Shiny applications from scratch, there’s no need for you to invest too much concentration into the project. Writing text prompts in plain English is less involved than writing code. Everything is fine until AI can’t solve the bugs you’re running into, and you’re left examining hundreds of lines of code you haven’t written in the first place, not knowing where to start.
- It’s just a matter of time before you hit a wall - When working with LLMs, the focus shifts from building to delegating and correcting mistakes. Delegating is still hard, but it’s the easier of the two. Fixing bugs can be frustrating and time-consuming, and it often requires a deeper understanding of Shiny.
- It doesn’t save you that much time - This argument is twofold. First, you need to write and refine the prompts before submitting them to an AI model. It took us close to two hours to write the prompts for this app! And second, if you reach a point where AI can’t solve bug(s), you don’t only have to solve them yourself, but you also need to understand potentially messy AI-generated code.
- Sensitive data - You should never share sensitive information about your company and security credentials with an AI tool. Shiny Assistant is no exception. Masking sensitive parts of your code takes time, both going in and out.
Shiny Assistant Cons
The tool is still in closed beta, so expect this list to change (and shorten) as time moves on.
Here are our gripes with Shiny Assistant after trying it for a couple of days:
- Assistant modes - Right now, you can switch between “Code only”, “Concise”, and “Verbose”, with “Concise” being the default. We’ve opted for “Code only” for this article, but Shiny Assistant still generated a lot of explainer text. It’s not a biggie, but it’s a bug we have to mention. It looks like a basic prompting error, so it shouldn’t take the Posit’s team too much time to fix it.
- Live preview sometimes breaks - You’ve seen it in the screenshots of the previous section. Again, it’s not a deal-breaker, but copying or downloading the code to a local machine takes time and breaks the seamlessness of the Assistant.
- Code generation - Shiny Assistant always writes the entire application code from scratch. Since the model running in the background generates it token by token, it takes time, even for the simplest of prompts. You might consider this a real issue for more complex apps, but in our case, it was just a minor inconvenience.
- It’s currently just a web app - We’d love to see Shiny Assistant as a plugin or an integral part of RStudio and/or Positron.
The last two points are more of a wishlist for a production version of Shiny Assistant.
Summing up Shiny Assistant
To conclude, we think most Shiny apps will be kicked off with Shiny Assistant in 2025 and beyond.
There’s no reason not to use the tool. If you’re starting from a blank slate, the Assistant will get you moving in minutes instead of hours. Even if you’ve already built an app from scratch, you can still use Shiny Assistant as an idea generator to explore new features and improvements to the existing ones.
We’d love to see Shiny Assistant as an integral part of data science IDEs, such as RStudio and Positron. Not only would that make it easier for Shiny developers, but it’ll give the Assistant a chance to generate and change only the code that’s needed at the moment instead of generating the entire app from scratch every time.
Long story short - join the waitlist if you haven’t already. Try it out.
We’d love to hear your thoughts on Shiny Assistant. Join our Slack community and share your experiences so far. It’s the best place to share prompts, code, and screenshots.
What else is new in the world of R and Data Science? Read our experiences from posit::conf 2024.
.png)


.png)
