Introducing LogAnalyzer: An Easy-to-Use Log Monitoring Tool for R/Shiny Applications
.png)
Posit Connect is often the de facto platform to deploy R/Shiny applications, Python applications, and Quarto-Shiny documents. And when something goes wrong, we immediately go and visit the logs. But often the logs are walls of text that we have to scour through and when you have been coding and debugging for hours, it is often that you miss the crucial line that could have pointed you right at the error.
We faced a similar problem earlier this year in our collaboration at Elkem, one of the world’s leading silicon manufacturers, where we have multiple apps per project deployed for multiple locations with varying levels of access. In about a week, thanks to an already documented idea, we were able to set up a rudimentary version of LogAnalyzer.
As we became heavy users of the app, we decided its value was too much to keep it to ourselves. Thanks to the openness of the team at Elkem, we are now able to present an open-source version of the same app.
To read more about our overall collaboration with them, you can visit the case study.
While there are other very capable log-monitoring tools like Grafana, setting them up is somewhat complicated and requires you setting up a whole infrastructure, perhaps, on a cloud provider. Often, there is a huge amount of collaboration and process management involved and not everyone has that kind of time or resources.
LogAnalyzer’s value is in how easy it is to set up and use, and how it leverages the existing Posit Connect infrastructure. The simplicity and ease of use and setup is often all you need. That’s where LogAnalyzer comes in. It’s ready to use out of the box, is set up with a simple deployment that can be made by anyone who has access to the Posit Connect server.

🤔 How LogAnalyzer Works
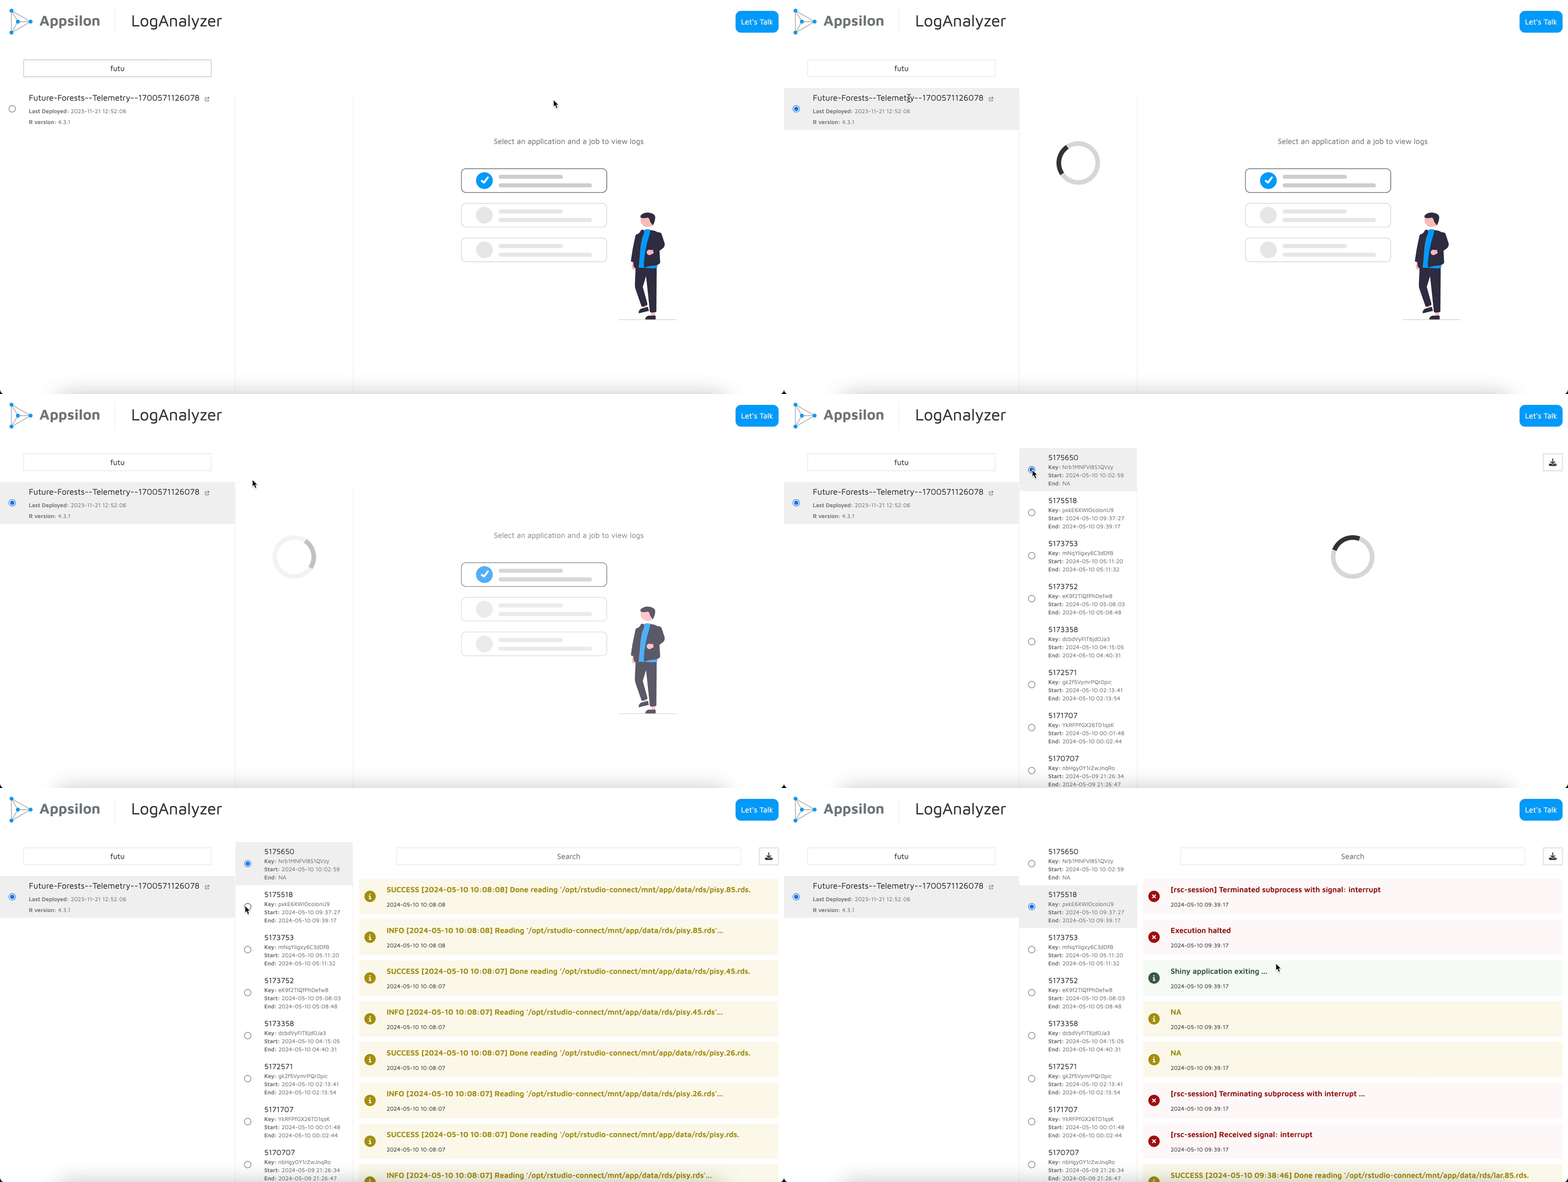
The LogAnalyzer app has three panes, as you can see in the GIF above. The first pane is simply the list of Deployments available on the Posit Connect server it is deployed on. The second pane lets you pickup a job (deployment or run) based on the Job Id.
There is also the timestamp placed conveniently for you to check the deployment you want to explore. And then, you get semantically coloured logs for the Deployment and the Job in question.
🔴 Reds signify all stderr statements (and some nifty keywords such as ‘halt’ or ‘terminate’).
🟡 Yellows are the stdout statements.
🟢 Greens are, well, just simple prints and other harmless lines. A simple glance can now tell you what went wrong.
What’s more? If you prefer to look at the text version, there is a download button available for you to download it. And since the app is powered by reactable under the hood, every part of it is searchable, making it even easier for you to find that pesky bug.
🔧 How to Use LogAnalyzer
Here comes the beautiful part. You don’t have to do anything. Deploying your own copy of LogAnalyzer is as simple as 1, 2, 3.
Under the hood, LogAnalyzer uses Appsilon’s {rhino}, which enables an industry-best practices approach to R/Shiny app development so you can be rest assured it’s built with an opinionated approach in mind. Also, the views leverage the popular {reactable} package so everything is searchable. The three panes are, in essence, three heavily customised reactable tables. And the app uses Posit Connect’s official API so all your data passes through secure channels, seamlessly.
Explore the capabilities of the Rhino package and start building your first app today by following our step-by-step tutorial.
1. Clone the App
You can check out the GitHub repository. If you prefer to use the terminal, it’s as simple as:
git clone git@github.com:Appsilon/LogAnalyzer.git2. Deploy the App
Before you do this step, we recommend restore the {renv} environment using:
renv::restore()Alternatively, if you want to test the app locally first, you may have to add some necessary environment variables to your .Renviron file on your own (you can use the usethis::edit_r_environ() from the {usethis} package to do this as well).
Here, you can set the CONNECT_SERVER and CONNECT_API_KEY environment variables and don’t forget to restart your session.
- The
CONNECT_SERVERis the address to your Posit Connect instance. If you access your apps usingconnect.yourorganisation.com/app1, theCONNECT_SERVERvalue isconnect.yourorganisation.com. - The
CONNECT_API_KEYcan be generated from the Posit Connect dashboard and grants the user programmatic access to all deployments. The documentation for the Posit Connect API can be found here.
Note that these environment variables are available to default to any deployed app on Posit Connect, and you only need to set these up locally. To learn more about them and to generate an API key, you can check the official Posit Connect documentation.
👉 Tip: You can also change the logo in app/static and modify the mod_header.R to make it truly your own.
Now, you can simply deploy the application to Posit Connect either with the {rsconnect} package or with the RStudio GUI
3. Set CONNECT_API_KEY (or not)
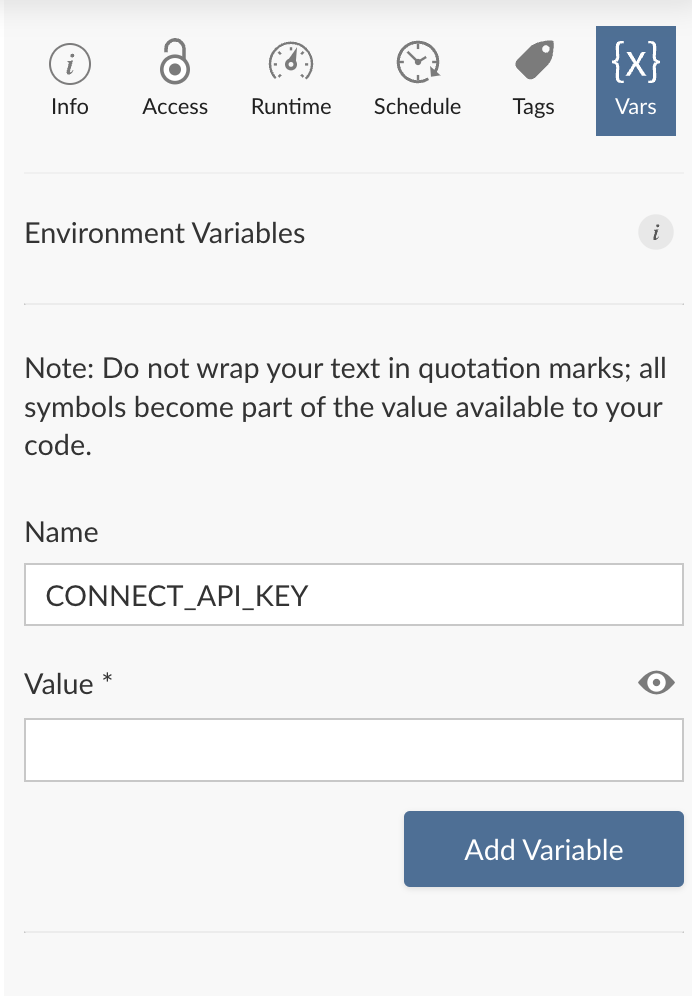
There are two ways to go about this: either let Posit Connect set the CONNECT_API_KEY for you automatically or set the environment variable in the Vars section of the Posit Connect GUI for the application yourself.
What’s the difference between these two approaches? It boils down to who is using LogAnalyzer and the intended usage.
- If you are deploying LogAnalyzer for personal use and want to analyse logs only for your own apps—that you deploy yourself—then use the first approach and let it all work on its own. You don’t need to set up an environment variable at all.
- If you want LogAnalyzer to be accessed team-wide with access to all logs for all deployments to all users, you could manually set up a key for a user with Admin rights or who belongs to the group with access to all apps. This way, the LogAnalyzer instance would be able to fetch logs regardless of who deployed the app.

Either way, the CONNECT_SERVER will be set for you and defaults to the server the application is deployed on.
And voila 🪄! That really is it. You have your own instance of LogAnalyzer deployed and ready to use. No more sifting through long chunks of text!
📎 An Ending Note
We invite you to find issues with the application as well as think of potential improvements. If and when you see a way you can improve this application, feel free to raise an issue or a pull request. We look forward to your contributions!
Frequently Asked Questions
Q: What types of applications does LogAnalyzer support?
A: LogAnalyzer currently supports log monitoring for R/Shiny applications, Python applications, and Quarto-Shiny documents deployed on Posit Connect.
Q: Can I use LogAnalyzer for applications not deployed on Posit Connect?
A: No, LogAnalyzer is designed to work with the Posit Connect infrastructure and leverages the Posit Connect API to fetch log data.
Q: How does LogAnalyzer handle large log files?
A: LogAnalyzer uses the {reactable} package under the hood, which allows for efficient rendering and searching of large datasets, including log files.
Q: Can I customize the color scheme for log entries?
A: Yes, the color scheme for log entries (red, yellow, green) can be customized by modifying the appropriate CSS styles in the app's code.
Q: Is LogAnalyzer open-source?
A: Yes, LogAnalyzer is an open-source project, and you can find the repository on GitHub.
Got questions or feedback? Join our community and start a conversation!

.png)


.png)