Connecting R to Postgres: From Database Creation to Data Manipulation and Charts
.png)
Data science and statistics revolve around one key term - data. If there's no data, or you can't access it, there are no insights. It makes sense to invest some time into mastering databases and how to work with each straight from R.
That's where this article comes in. If you're wondering how to go about connecting R to Postgres, wonder no more. Today you'll learn how to provision a PostgreSQL database on Amazon AWS, and also how to connect to it from R, create tables (2 ways), insert data, select data, and use database data as a basis for data visualization.
Working with string data in R can seem tough - but it doesn't have to be. Read our comprehensive guide to R stringr.
Table of contents:
- Postgres Database Setup on AWS - A Complete Guide
- How to Connect R to Postgres with DBI
- Connecting R to Postgres - Creating Tables
- Inserting and Selecting Data into Postgres from R
- Connecting R to Postgres - Data Manipulation and Aggregation
- Visualizing R Postgres Data with ggplot2
- Connecting R to Postgres - Summary
Postgres Database Setup on AWS - A Complete Guide
First things first, we need a database. This section will walk you through setting one up on Amazon AWS, and you'll also see how to test the connection. It's assumed you have an AWS account configured already.
Keep in mind that there are plenty of choices when it comes to hosting a Postgres database. Some alternatives to AWS are Turso, Vercel, Supabase, Heroku, ElephantSQL, and so on - all of which are completely free or include a free tier.
Creating a New Database Instance
To start, log into your AWS account and navigate to RDS. Once there, click on Databases. You won't see anything there if this is your first time setting up a database on AWS:
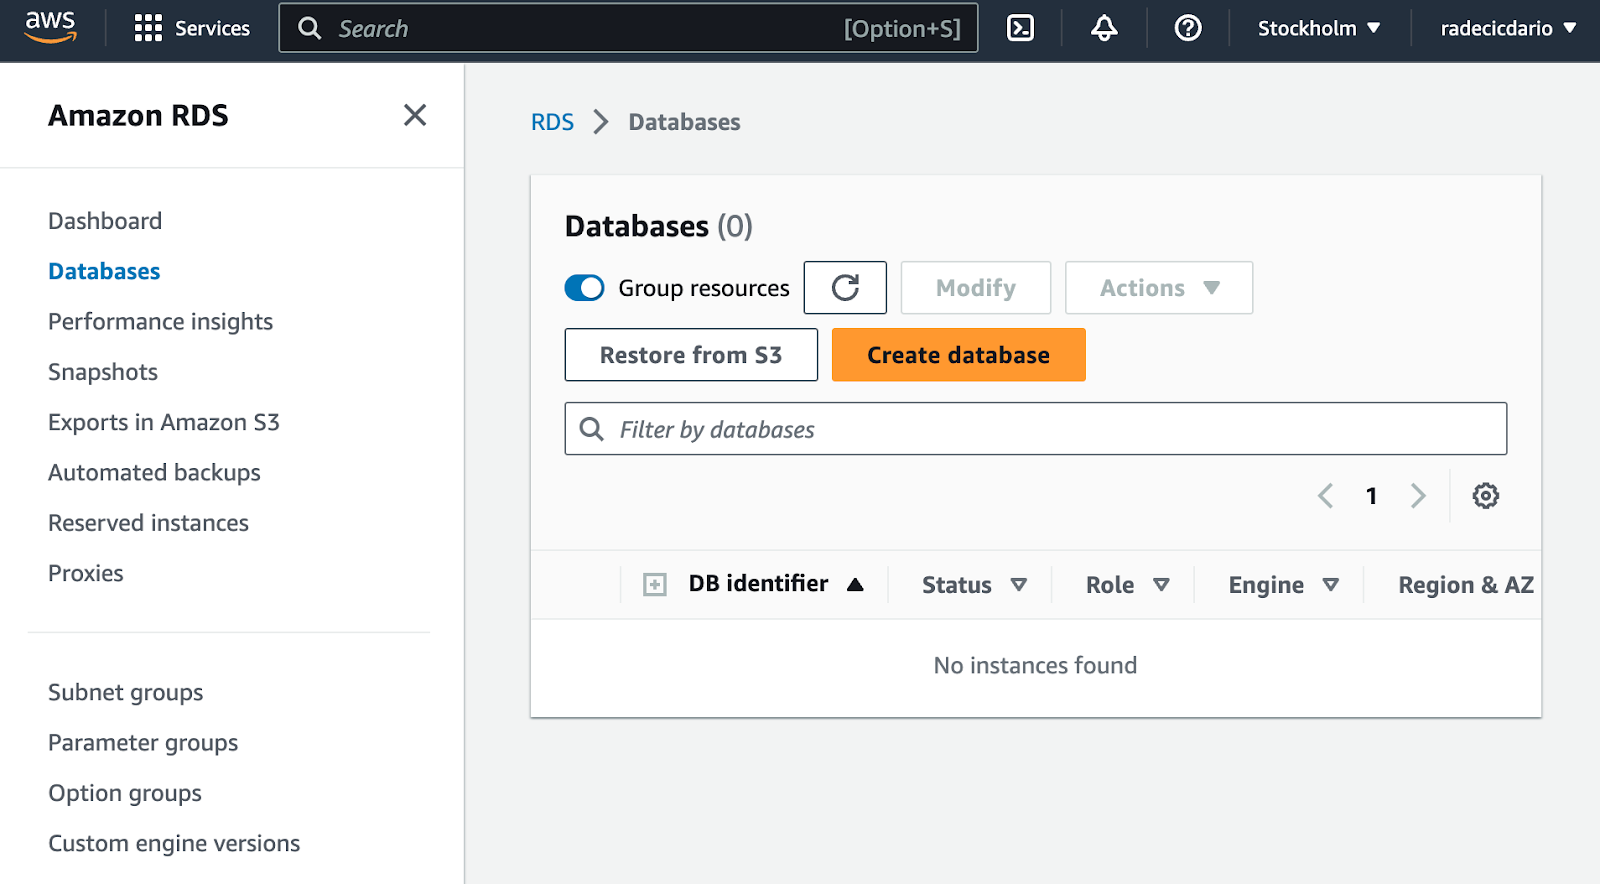
To start provisioning a database, click on the big orange Create database button. It will redirect you to a configuration page.
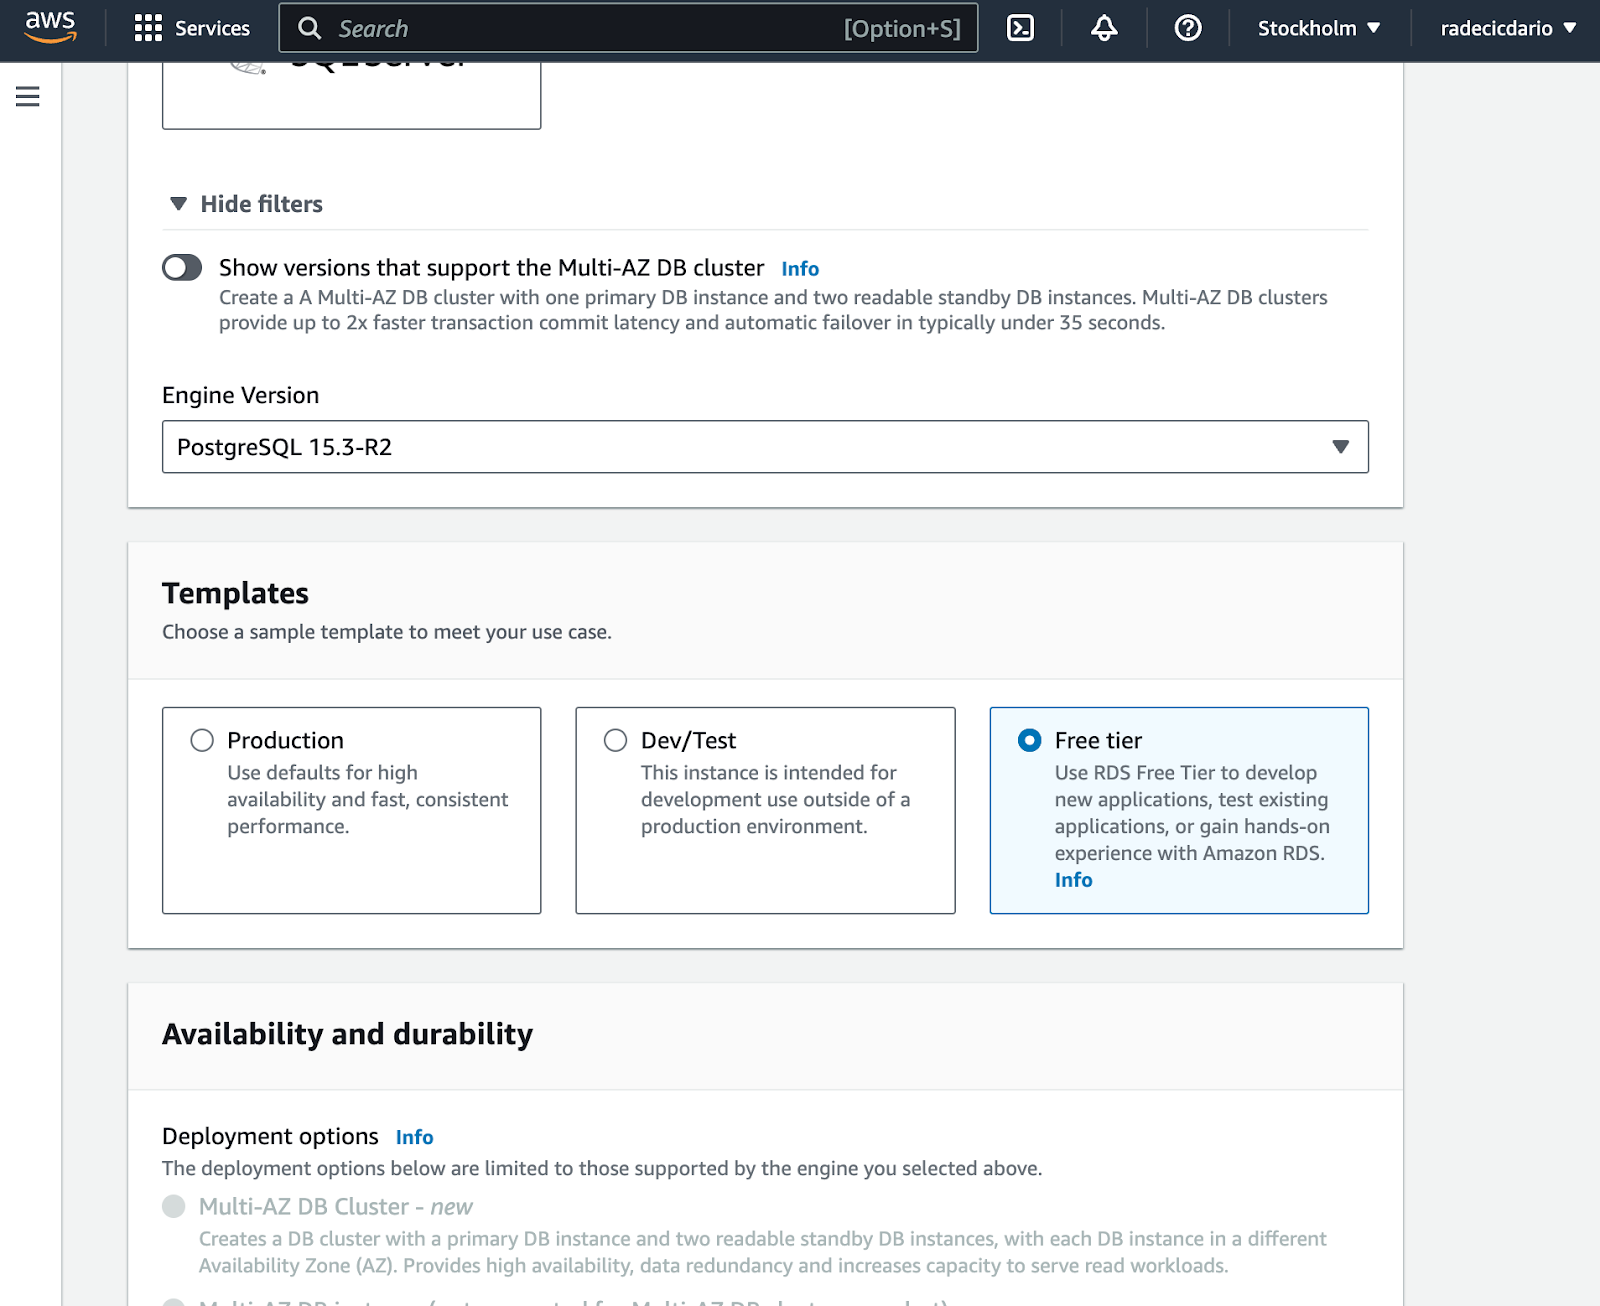
We'll use the standard database creation mode and will choose PostgreSQL as an engine of choice:

Below the engine selection, make sure to use the Free Tier template. Contradictory, it's not entirely free and will cost you around $0.5 per day:
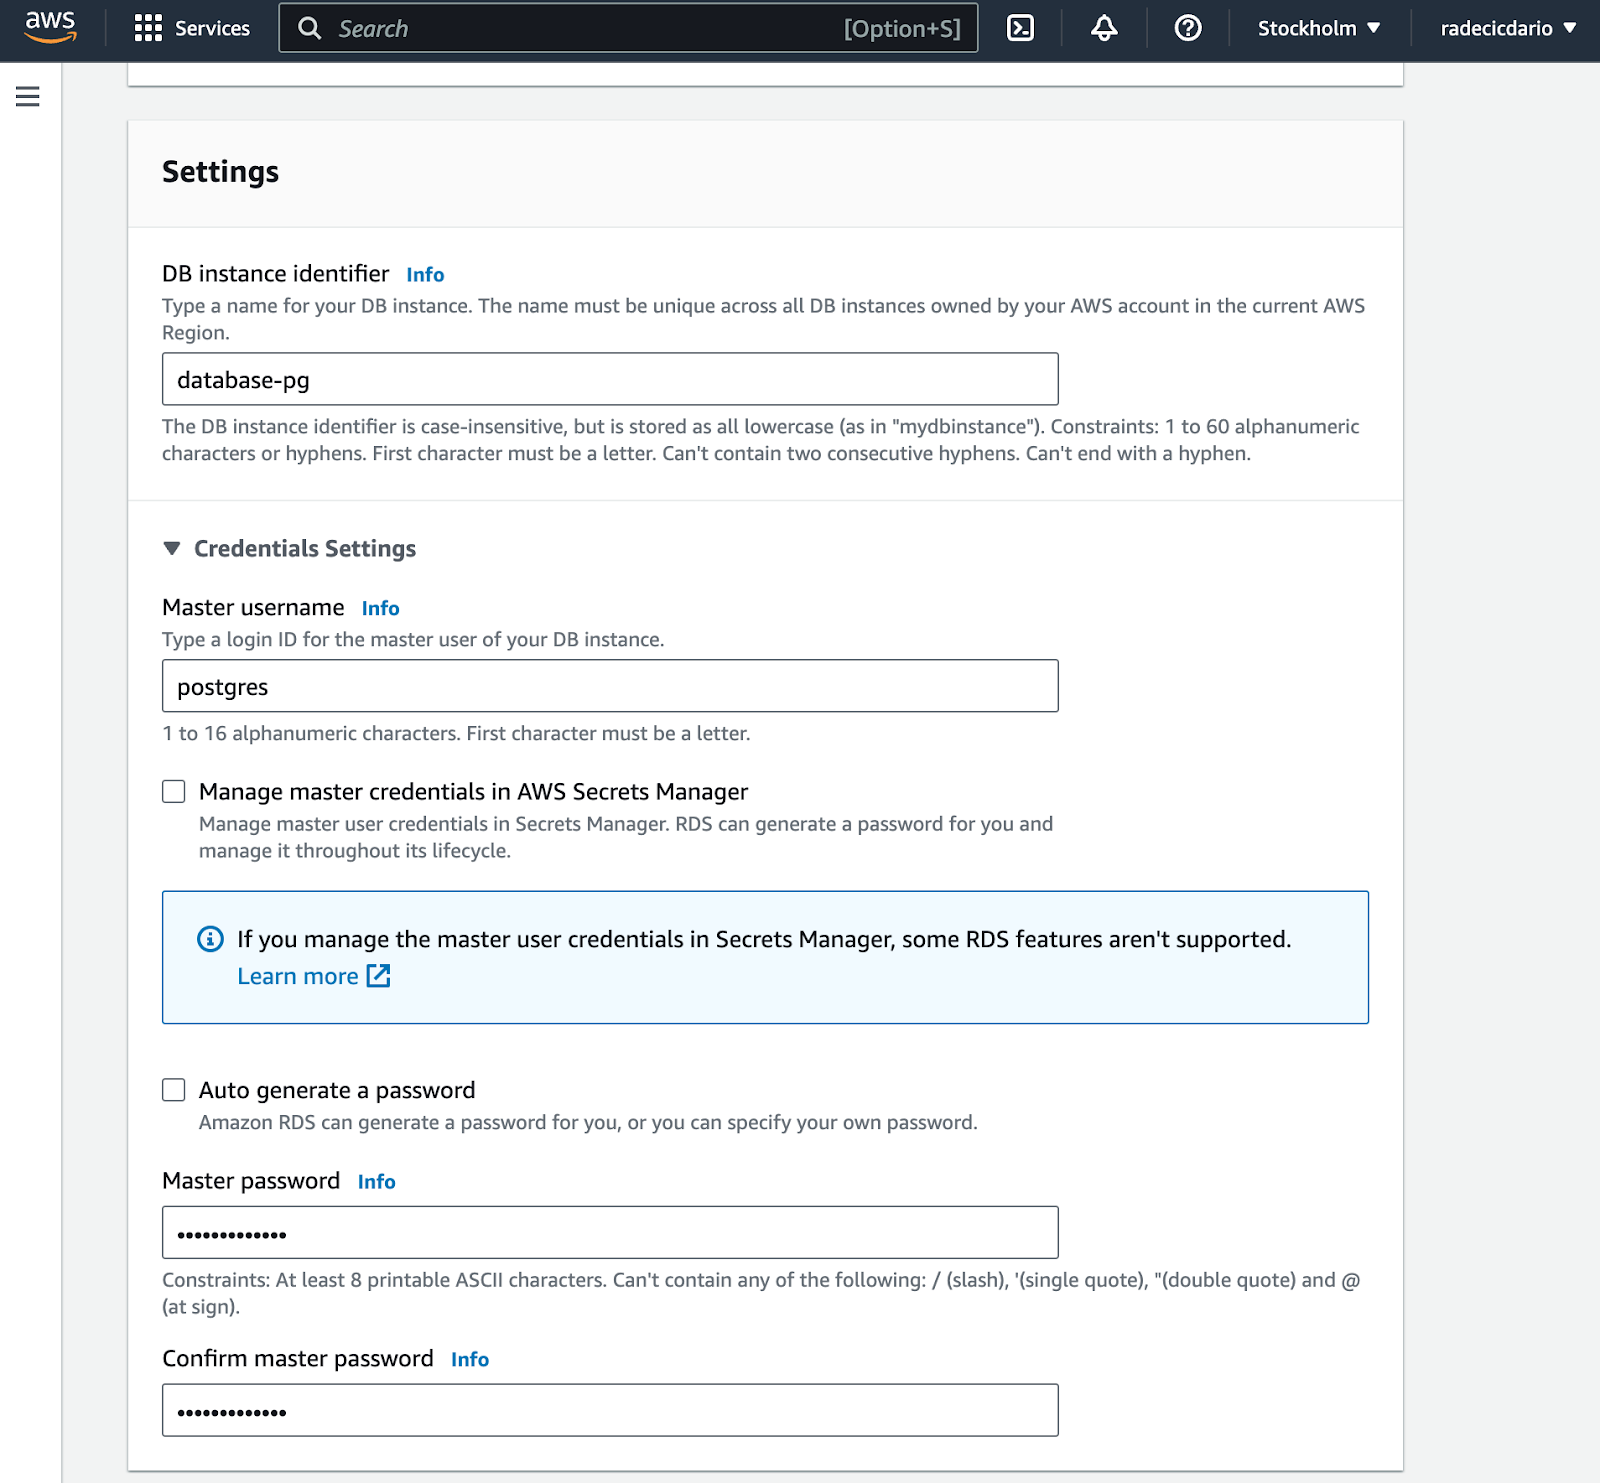
As for the database settings, make sure to remember the database instance identifier, username, and password. You'll need these later when establishing a connection, so write them somewhere safe:
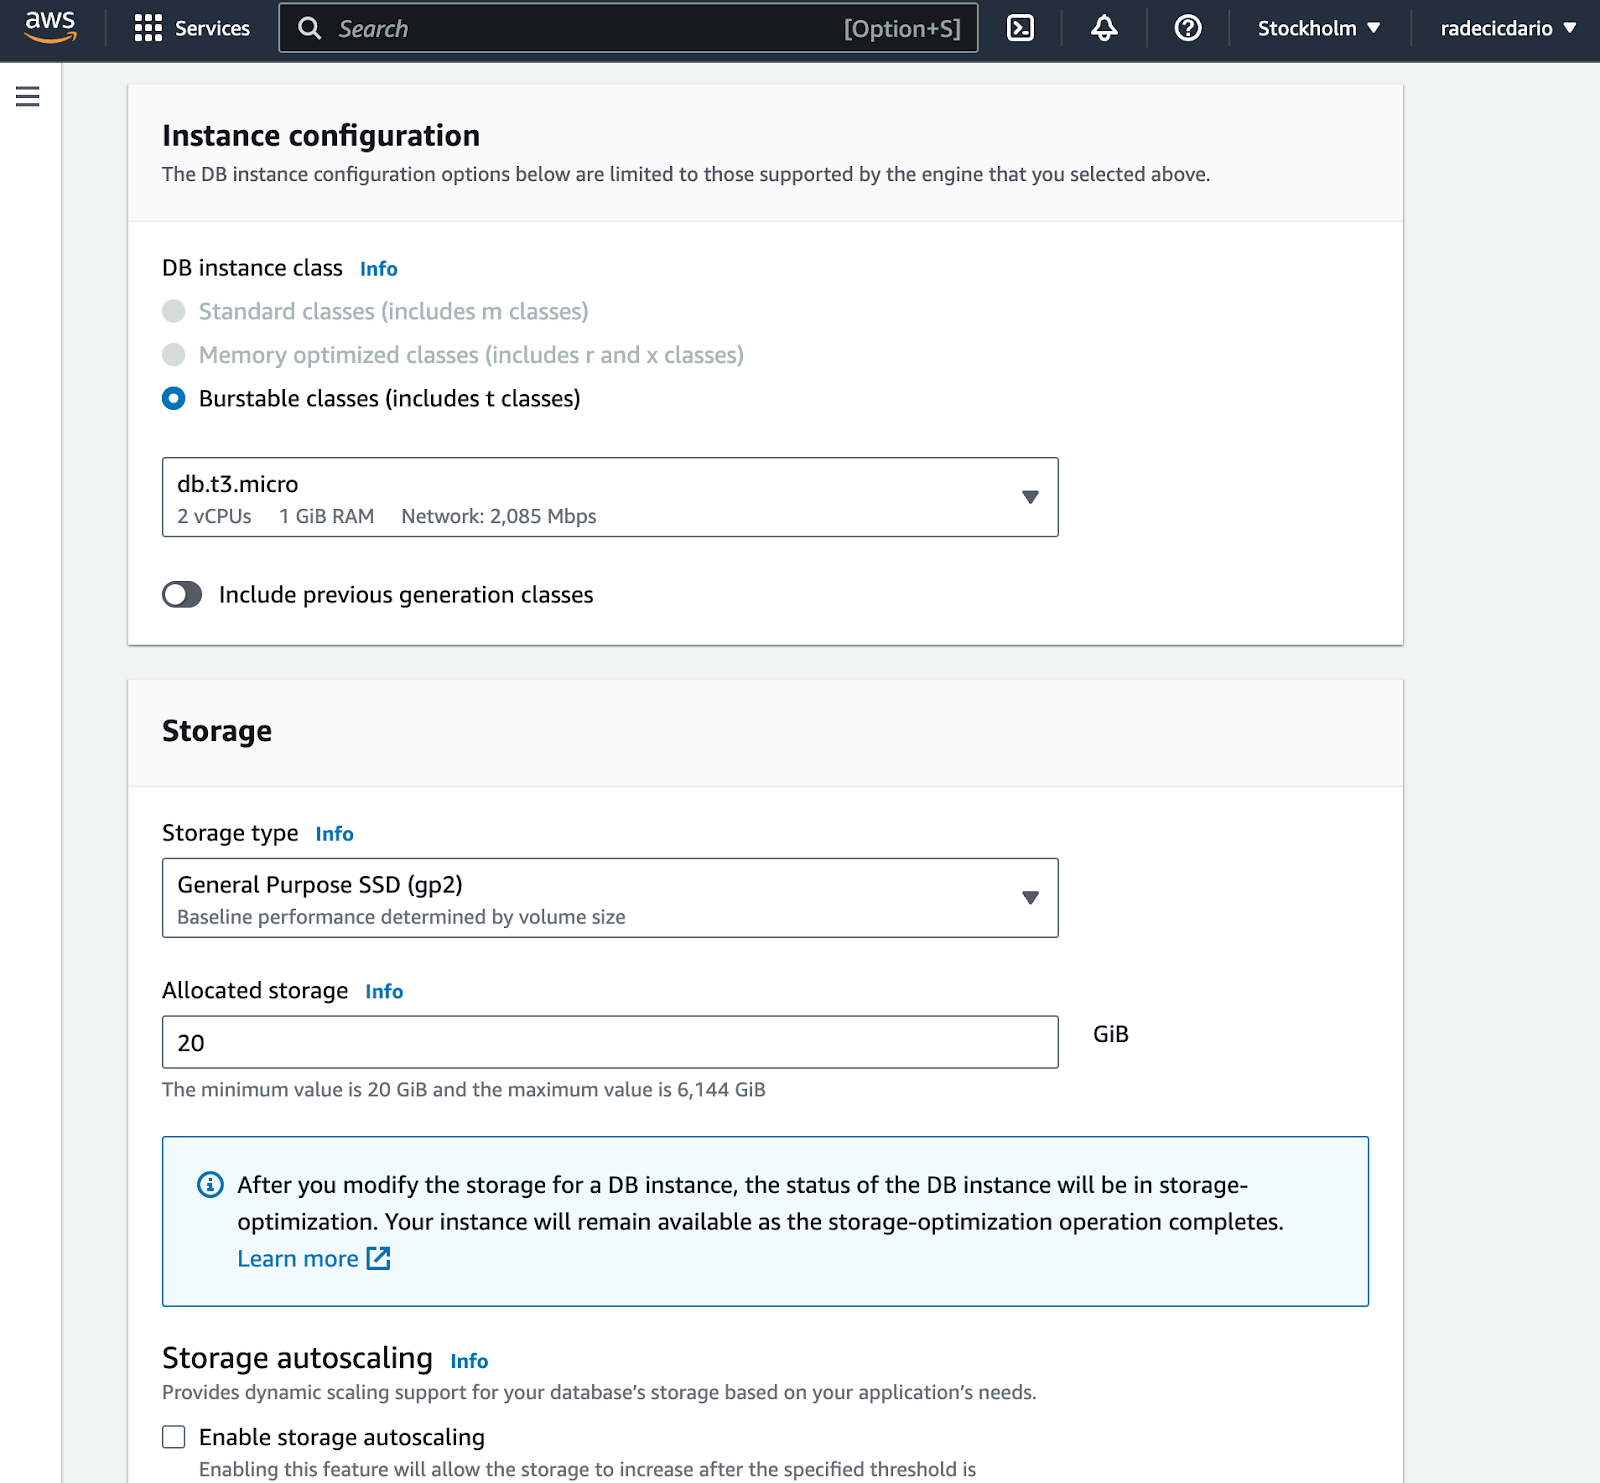
The rest of the settings can be pretty much left on default. We need the cheapest CPU/RAM configuration and the least amount of storage (20 GB). You can also disable storage autoscaling:
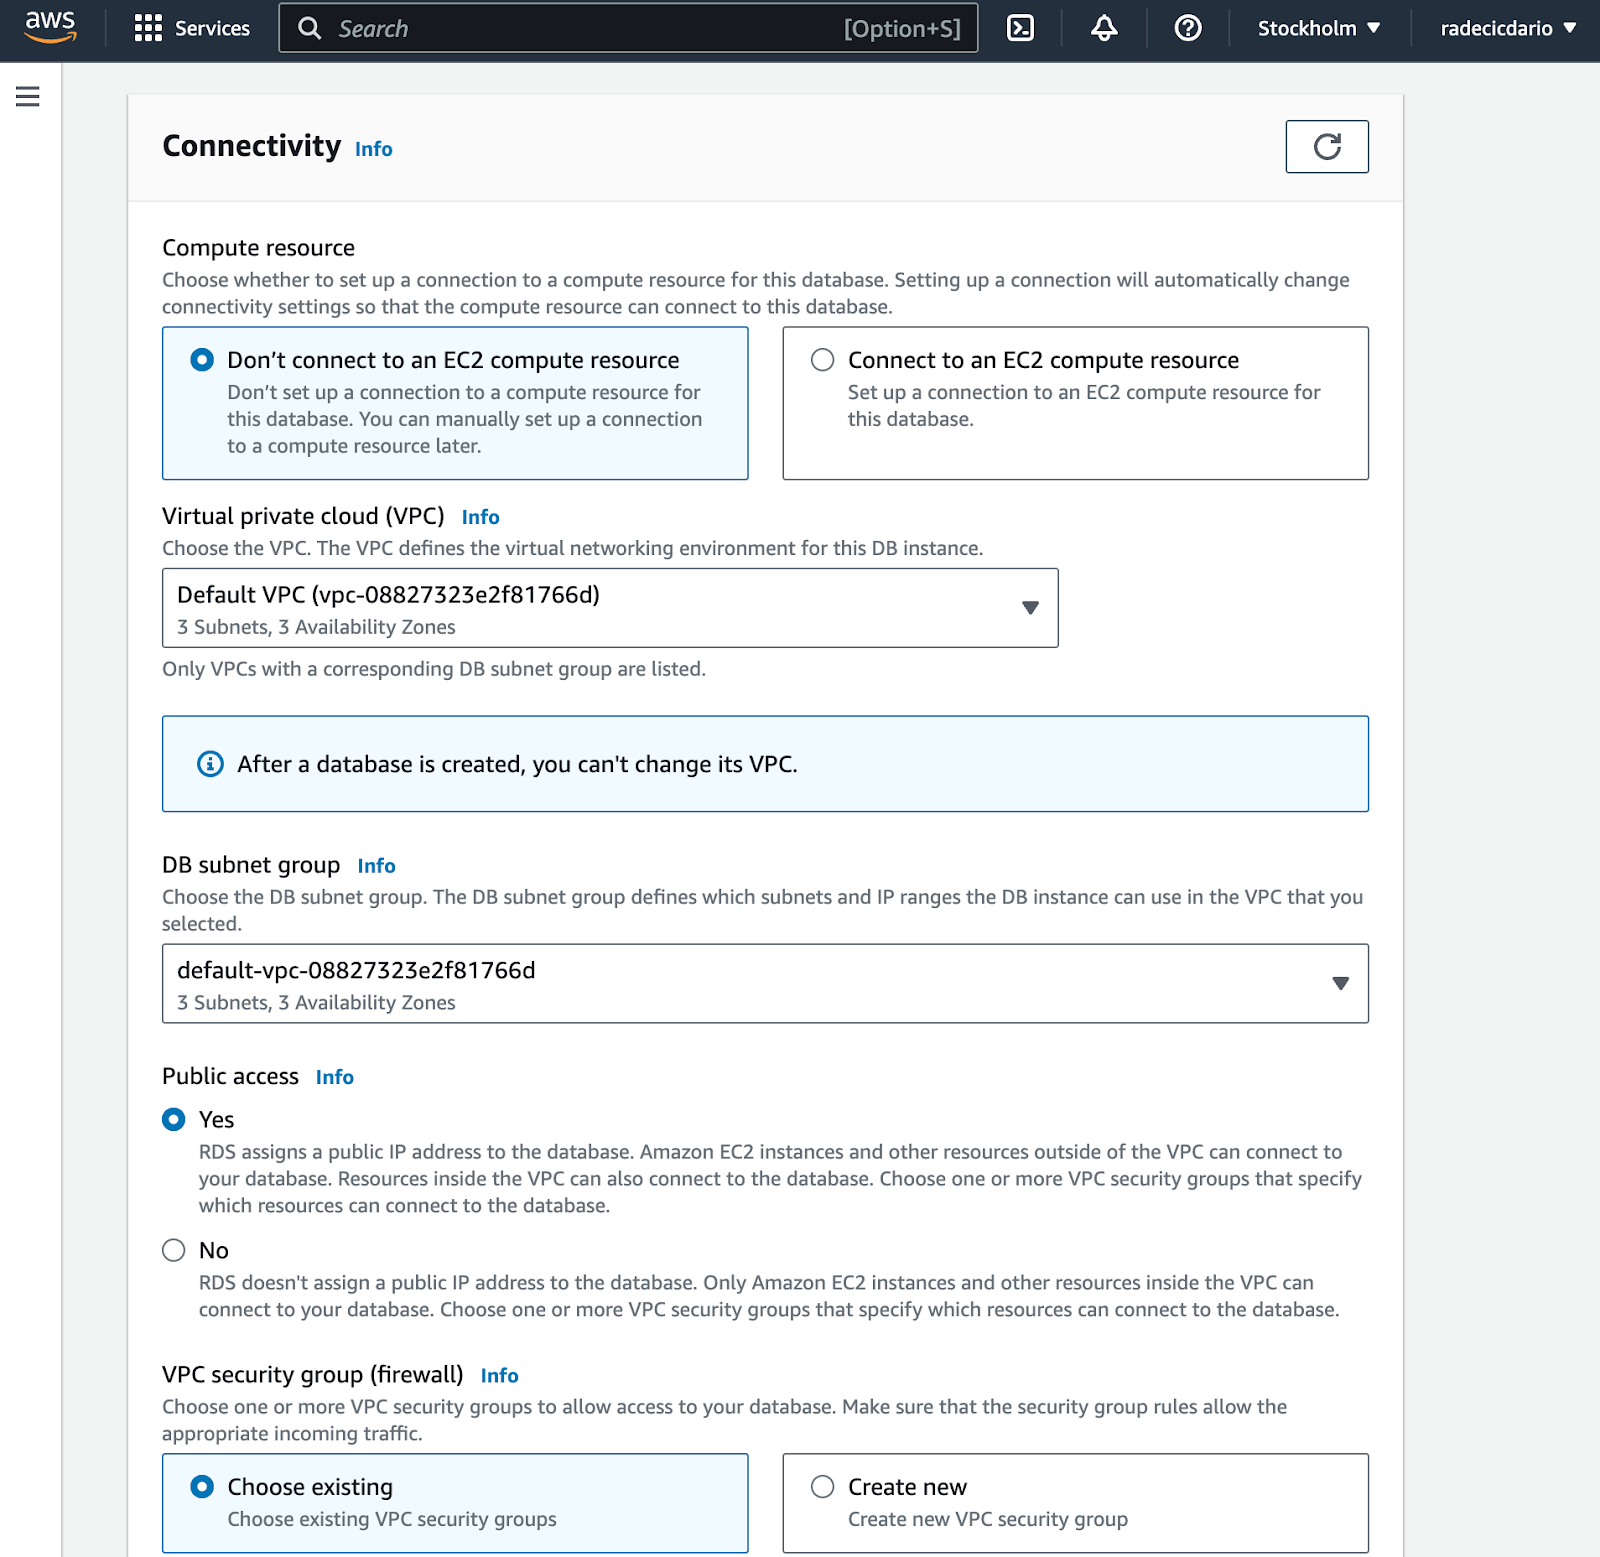
Instance connectivity is where you want to pay attention. It's crucial to enable public access, so you can actually access your database from R. This will assign a public IP address to the database:
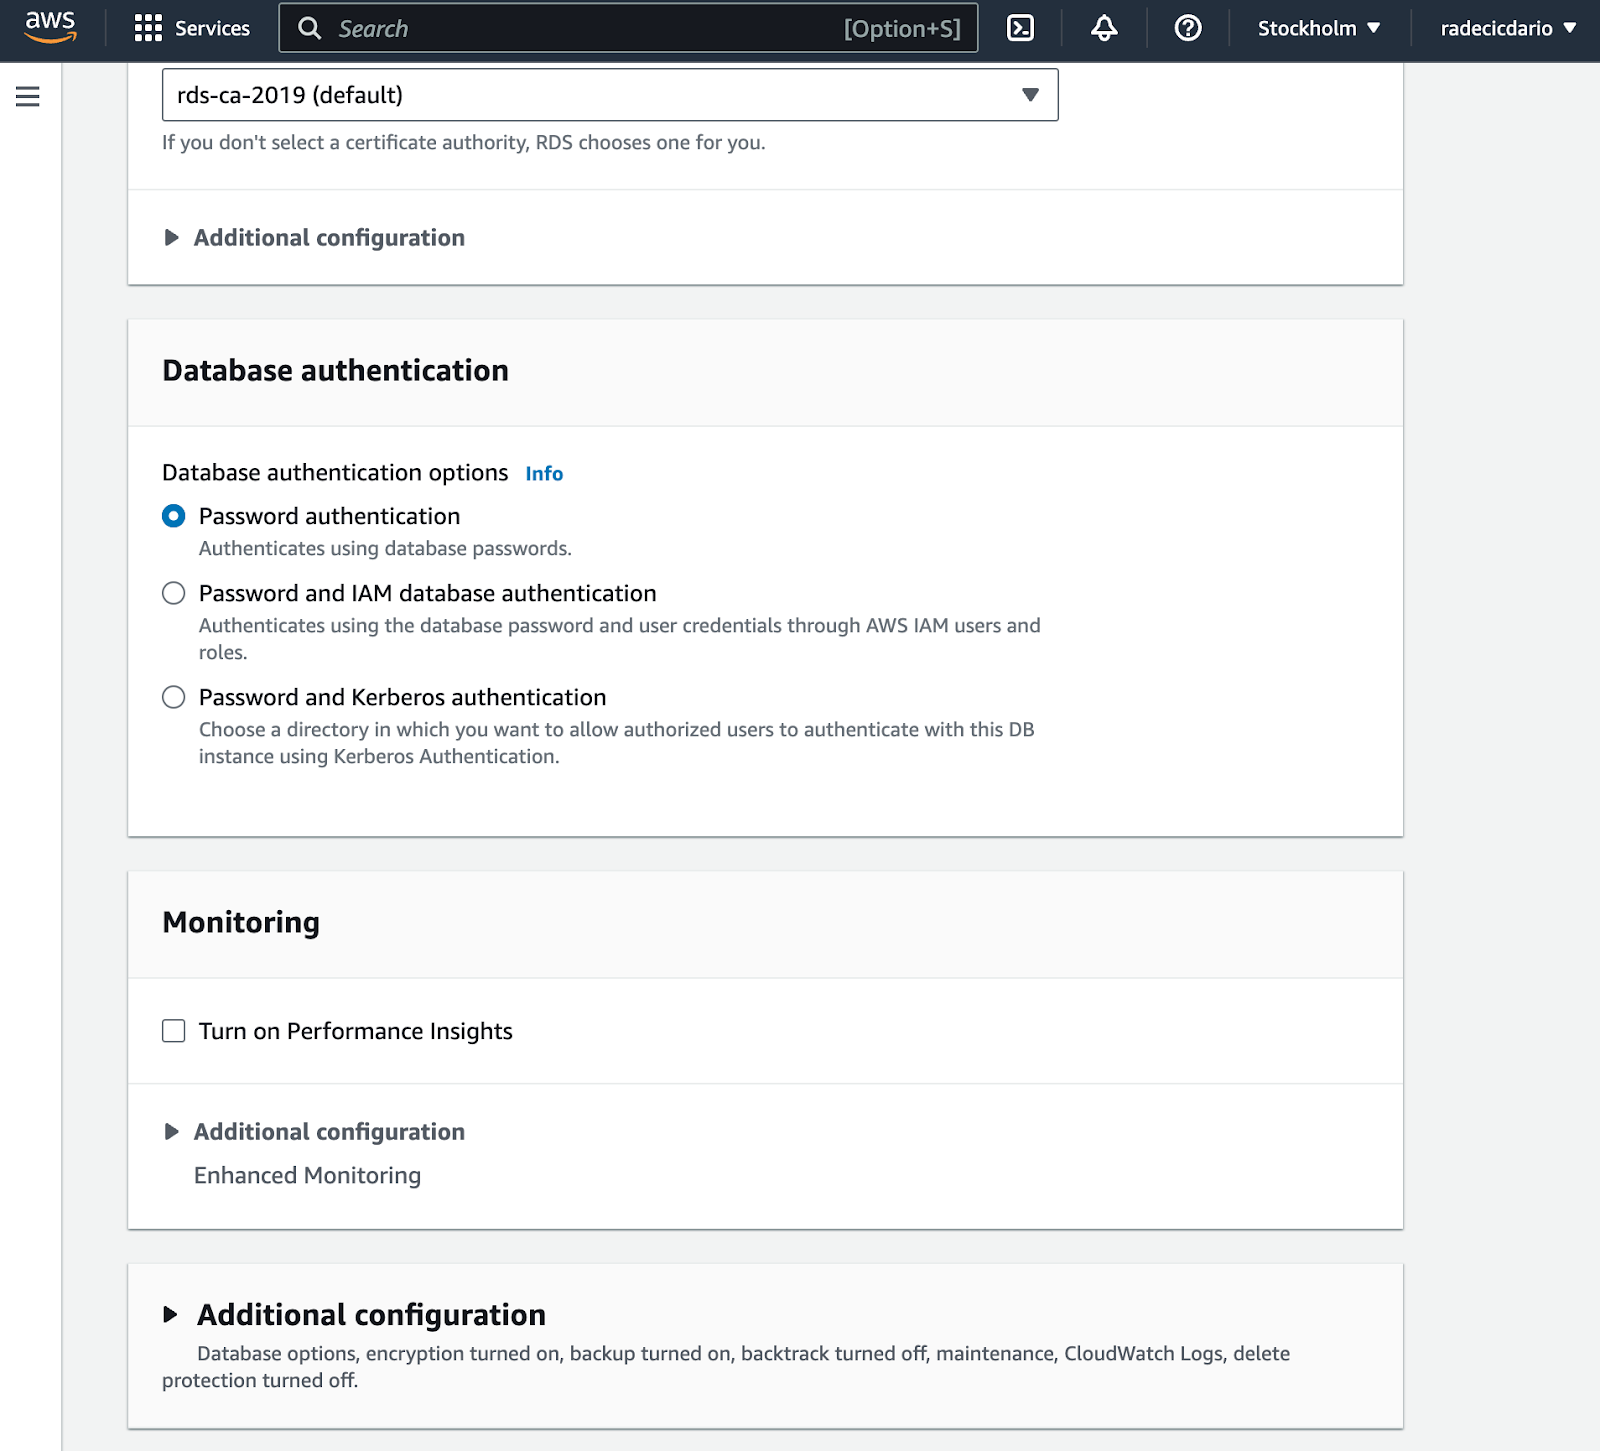
Almost there! Regarding database authentication, leave it to the default password option:
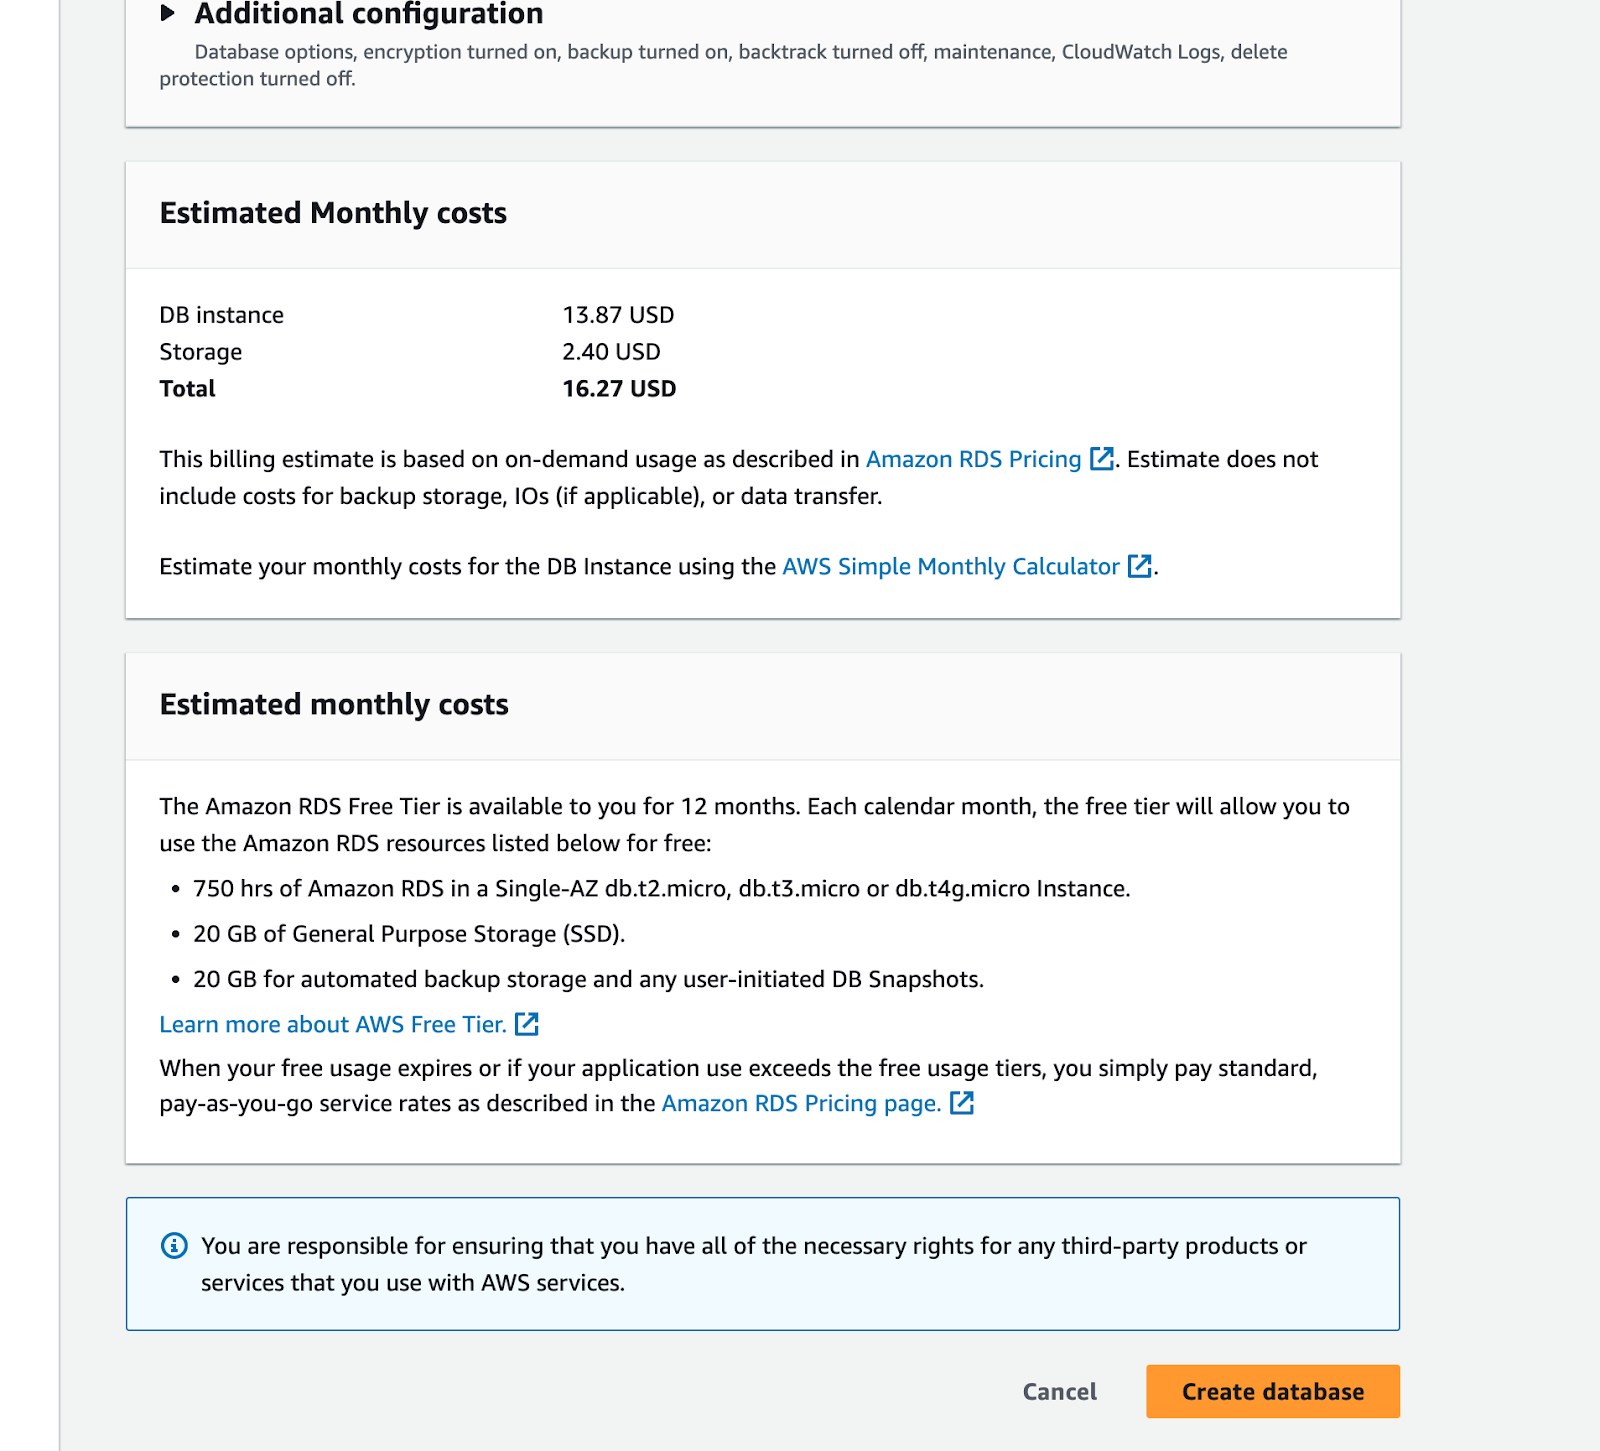
And now finally click on the Create database button:
Provisioning the database might take a couple of minutes. It took between 5 to 10 minutes on our end, so just wait until you see that the database is available:
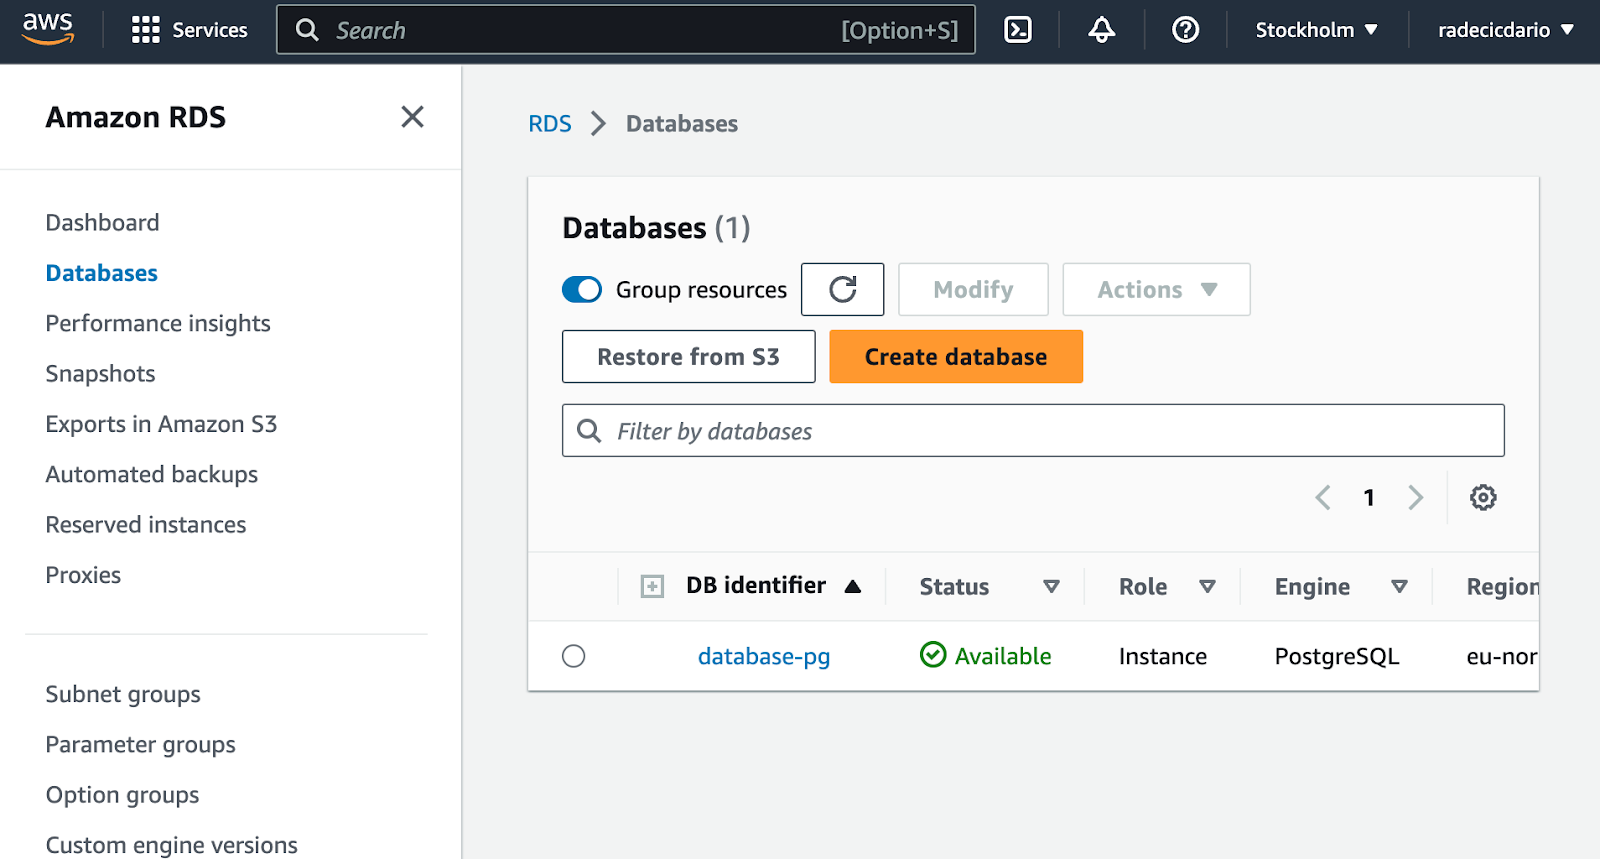
And that's it! You've successfully provisioned a PostgreSQL database on Amazon AWS. Let's see how to connect to it next.
Establishing a Connection to a Postgres Database
Before you can establish a connection, you need to get the connection parameters. Simply click on the database identifier and you'll be redirected to the following screen:
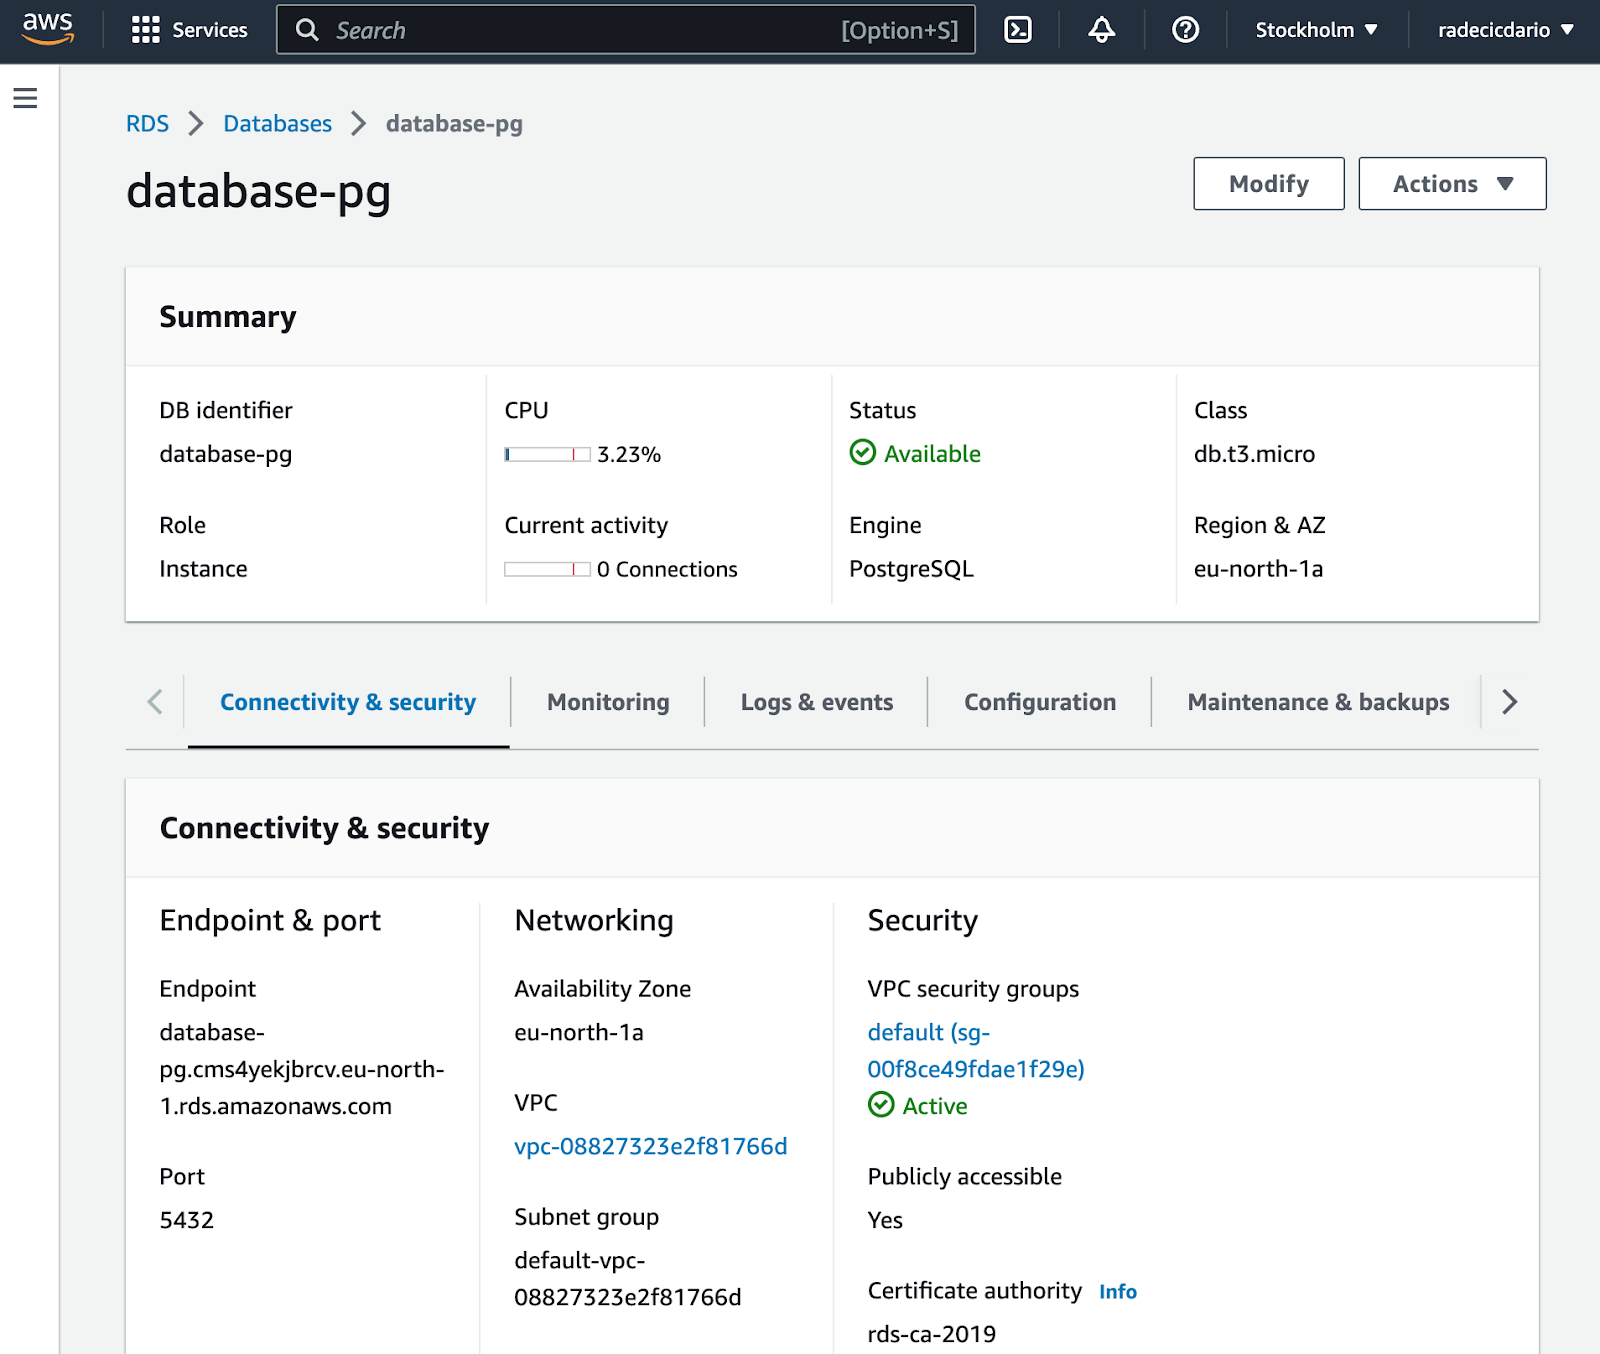
From here, make sure to copy the Endpoint and Port values. You'll also need a username and password, but you already know these (specified when provisioning the database).
We won't use R in this section since we only want to verify the database was provisioned successfully and that you can access it from anywhere.
We're using a free GUI tool named TablePlus. You can also download it, enter the connection parameters, and click on Test to test the connection.
If the fields get a green overlay, it means the connection to your database can be established:
[caption id="attachment_20220" align="alignnone" width="612"]

On the other hand, if the fields get a red overlay, it means you've probably entered one or more of the connection parameters wrong.
Let's assume yours is green like ours and proceed to the following section.
How to Connect R to Postgres with DBI
This section will walk you through connecting R to Postgres. You'll see the best practice for doing so, and the best practice to remove database credentials from your R scripts.
Setting up the .env File
Okay, so, what is an .env file? It's a file that holds environment variables for your project. You can separate sensitive info and auth credentials from your R code, and simply add .env file to .gitignore.
That way, everyone will be able to see your code, but no one will know your security credentials. Neat!
To start, create a .env file. It's not a typo - the file has no name, just the extension. Once created, paste the following inside it:
DB_HOST=
DB_PORT=
DB_USER=
DB_PASS=
And, of course, populate it with your database connection values. There's no need to wrap string data with quotes.
Establishing R Postgres Connection
You can now use the dotenv R package to load in the environment variables. Also, load the DBI package for establishing a database connection:
library(DBI)
dotenv::load_dot_env()
Of course, install any of these packages if you don't have them already.
Finally, to establish an R Postgres connection, use the dbConnect() function from DBI. It requires you to enter connection parameters, which can be obtained from the loaded environment variables:
pg_conn <- dbConnect(
  RPostgres::Postgres(),
  dbname = "postgres",
  host = Sys.getenv("DB_HOST"),
  port = Sys.getenv("DB_PORT"),
  user = Sys.getenv("DB_USER"),
  password = Sys.getenv("DB_PASS")
)
And that's the database connection for you. You're good to proceed to the following section if this code block doesn't throw an error. If it does, make sure you've entered the connection parameters correctly and also make sure R can access your environment variables.
Connecting R to Postgres - Creating Tables
The good thing about the R Postgres connection is that you can directly run SQL queries. We'll run one in this section to create a table. There's an alternative table creation method, but more on that in a bit.
We'll store some dummy employee data, and the database table will hold information on the employee's name, email, department, salary, and hire date.
The dbSendQuery() function is used to run a SQL statement from R:
dbSendQuery(
  conn = pg_conn,
  statement = paste(
    "CREATE TABLE employees (",
    "emp_id SERIAL PRIMARY KEY,",
    "emp_first_name VARCHAR(32),",
    "emp_last_name VARCHAR(32),",
    "emp_email VARCHAR(32),",
    "emp_department VARCHAR(16),",
    "emp_salary NUMERIC(7, 2),",
    "emp_hire_date DATE",
    ")"
  )
)
Provided your SQL statement is written correctly, you should see the following output:

DBI also provides a convenient function for listing all database tables - dbListTables(). We'll use it to verify our employees table was created:
dbListTables(pg_conn)
Here's the output:

Long story short, the table was created successfully. Up next, we'll show you how to insert data into Postgres through R.
Inserting and Selecting Data into Postgres from R
This section will show you one way of inserting data into a Postgres table, and also how to get the data back from Postgres to R.
How to Insert Data into Postgres from R
The most intuitive way to insert data into a Postgres table is by running multiple SQL INSERT statements. That's exactly what we'll do here.
You already know how the dbSendQuery() function works, so there's no need to explain it further. We'll use it here to insert a couple of employees into our table:
dbSendQuery(conn = pg_conn, statement = "INSERT INTO employees (emp_first_name, emp_last_name, emp_email, emp_department, emp_salary, emp_hire_date) VALUES('John', 'Doe', 'johndoe@company.com', 'IT', 5500, '2020-01-01')")
dbSendQuery(conn = pg_conn, statement = "INSERT INTO employees (emp_first_name, emp_last_name, emp_email, emp_department, emp_salary, emp_hire_date) VALUES('Mark', 'Smith', 'marksmith@company.com', 'IT', 6600, '2017-04-12')")
dbSendQuery(conn = pg_conn, statement = "INSERT INTO employees (emp_first_name, emp_last_name, emp_email, emp_department, emp_salary, emp_hire_date) VALUES('Jake', 'Dean', 'jakedean@company.com', 'Sales', 4800, '2019-07-01')")
dbSendQuery(conn = pg_conn, statement = "INSERT INTO employees (emp_first_name, emp_last_name, emp_email, emp_department, emp_salary, emp_hire_date) VALUES('Meredith', 'Jackson', 'meredithjackson@company.com', 'Sales', 4900, '2019-01-21')")
dbSendQuery(conn = pg_conn, statement = "INSERT INTO employees (emp_first_name, emp_last_name, emp_email, emp_department, emp_salary, emp_hire_date) VALUES('Susan', 'Dell', 'susandell@company.com', 'Marketing', 4500, '20179-09-19')")
The question now is - how can you know if the rows were inserted? Let's answer that next.
How to Select Postgres Data from R
In order to retrieve records from a Postgres table in R, you'll have to combine the dbSendQuery() and dbFetch() functions. The prior is used to run a SQL SELECT statement, while the latter fetches the results and stores them into a variable.
If you prefer code over text, here's the snippet for you:
employees <- dbSendQuery(conn = pg_conn, statement = "SELECT * FROM employees")
employees_df <- dbFetch(employees)
employees_df
And this is what the resulting employee data frame looks like:

Up next, we'll aggregate this data and show you an alternative way to store records in a database.
Connecting R to Postgres - Data Manipulation and Aggregation
The data retrieved in the previous section is in a familiar R data frame format. This means you can use packages such as dplyr to perform any sort of data manipulation and aggregation.
For example, we'll group the dataset by department and calculate a couple of summary statistics - number of employees per department, total monthly salary, and total yearly salary. We'll also rename one column to get rid of the emp prefix:
library(dplyr)

emp_summary <- employees_df %>%
  group_by(emp_department) %>%
  summarize(
    n_employees = n(),
    monthly_salary = sum(emp_salary),
    yearly_salary = sum(emp_salary) * 12
  ) %>%
  rename(
    department = emp_department
  )
emp_summary
Here's what the resulting data frame looks like:

Save Aggregated R data.frame to Postgres
It would be superb if we could somehow dump the entire R data frame into a database table, without actually needing to create the table first.
Well, today's your lucky day. DBI packs a dbWriteTable() function you can use to dump a data frame into a table. It will create the table for you if it doesn't already exist:
dbWriteTable(
  conn = pg_conn,
  name = "employee_summary",
  value = emp_summary,
  row.names = FALSE
)
To verify, we can list the tables to ensure the table was created:
dbListTables(pg_conn)
And it looks like it did:

Up next, let's use this aggregated table to make a data visualization.
Visualizing R Postgres Data with ggplot2
You can retrieve table data the same way as before - by combining the dbSendQuery() and dbFetch() functions:
db_emp_summary <- dbSendQuery(conn = pg_conn, statement = "SELECT * FROM employee_summary")
emp_summary_df <- dbFetch(db_emp_summary)
emp_summary_df
Here's what the data frame looks like:

The idea now is to use ggplot2 to make a bar chart showcasing yearly salaries by department, colored by the number of employees working in that department.
We'll also add some quick styles and axis labels:
library(ggplot2)

ggplot(emp_summary_df, aes(x = department, y = yearly_salary, fill = n_employees)) +
  geom_bar(stat = "identity", position = "dodge") +
  labs(
    title = "Yearly Salaries Across Departments",
    x = "Department",
    y = "Yearly Salary",
    fill = "# of Employees"
  ) +
  theme_minimal()
This is what the chart looks like:
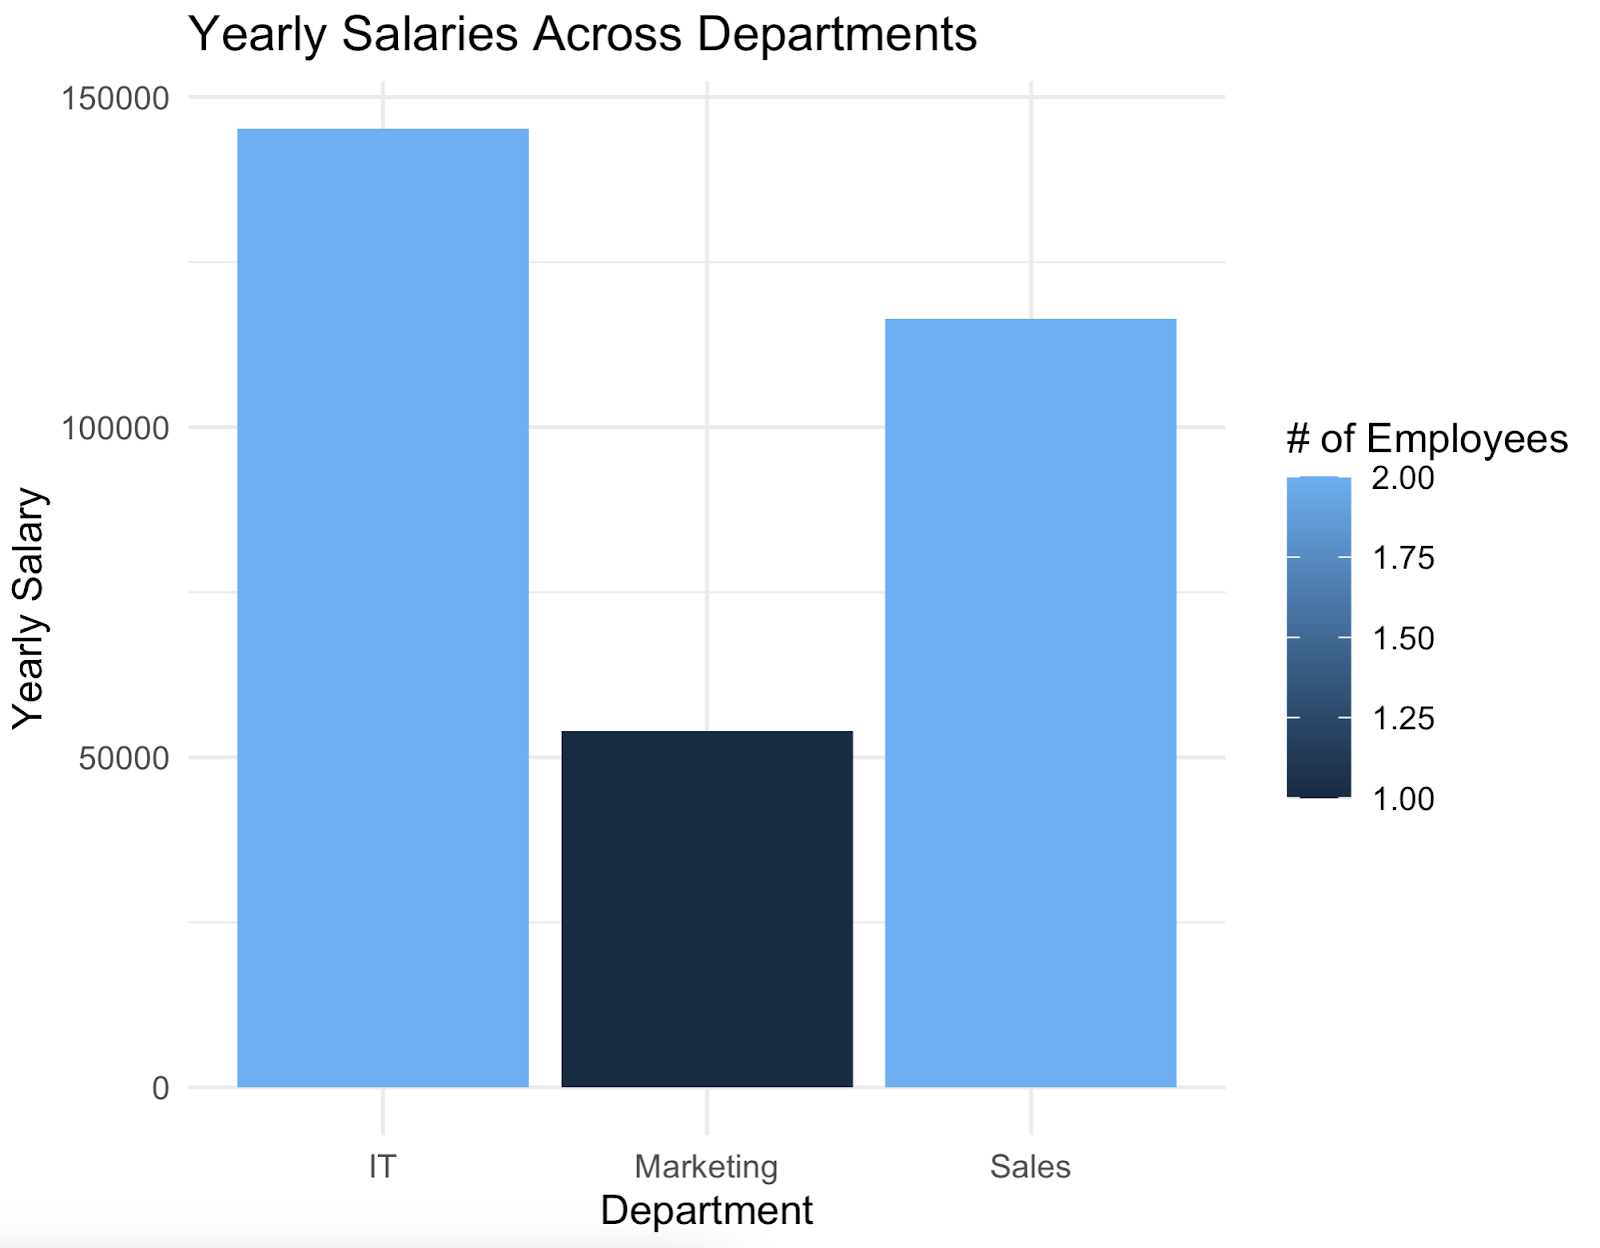
And that's how you can connect to a Postgres database from R and make a good-looking data visualization - all in a couple of lines of code.
Do you need more assistance in understanding ggplot2 code? We have plenty of articles for you, covering bar charts, line charts, scatter plots, box plots, and histograms.
Connecting R to Postgres - Summary
To summarize, PostgreSQL is probably one of the easiest databases to connect with from R. You only need to know the connection parameters, and there's no need to install any additional client/server software.
Probably the best thing about R is that it allows you to manipulate table data just like normal R data frames, and then dump the aggregated results back to a new table (or append to the existing one). There's no need to create the table first and then write a bunch or insert statements.
Do you think your code is production-ready? Leave nothing to chance by implementing package tests.
