


According to Exploding Topics, approximately 402.74 million terabytes of data are created each day (2024).
Now, not all that data is relevant to your line of business, but it does make one wonder - how in the world is someone supposed to make sense of it? The answer is simple but not easy - data visualization.
With the power of data visualization, interactive applications, and dashboards, you can easily turn huge piles of unorganized data into charts that tell a story. Visualization is particularly important in complex industries such as pharma and life sciences. In these fields, you’re dealing with difficult-to-comprehend topics, so replacing raw data with stunning visuals is a guaranteed way to get everyone on the same page.
That’s where R Shiny comes in.
Loved by many (especially us at Appsilon), Shiny is a seasoned go-to framework for building interactive dashboards and applications in a programming language widely used in pharma and life sciences - R.
This article will tell you all you need to know about R Shiny. And we mean all literally. If you’re a decision maker in a pharmaceutical company, you’ll have 95% of your questions answered after reading this article.
As for the remaining 5%, we encourage you to reach out.
Introduction to Shiny for R
Shiny is a framework used to build interactive data visualizations, dashboards, and applications, all within the R programming language.
It was first introduced way back in 2012 by Posit (formerly known as RStudio) as a way to help data professionals create dynamic applications without spending weeks or months learning web development. In other words, Shiny allows you to create data-driven applications without writing a single line of HTML, CSS, or JavaScript.
Of course, you can (and probably should) bring web technologies to Shiny, but it works perfectly fine without them. Some functionality might be limited without them, though, especially if you want an eye-catching dashboard. It’s not possible without CSS.
Where Shiny shines is in power and simplicity.
Just by knowing R, which most pharma and life science developers and researchers do, you can quickly create applications that present your insights and conclusions in an interactive way. You can also share these apps with peers, stakeholders, decision support teams, or the general public.
Deployment and version control are easy with Shiny, but that’s something we’ll get to in a moment.
For now, just remember these key reasons why you and your company should adopt Shiny:
- Ease of use: If you already know R, Shiny will feel right at home. There’s no need to learn additional programming languages or a dozen JavaScript frameworks.
- Interactivity: Shiny apps allow your users to input values, filter data, and visualize results dynamically. It’s light years ahead of Excel or any other reporting system you have in place.
- Ease of deployment: Once you build your Shiny app, you have many good options when it comes to deployment - after which your users will be able to access it from anywhere with just a browser.
- Customizability: You can develop simple apps for yourself or build complex, professional-grade dashboards for hundreds or even thousands of concurrent users.
Up next, we’ll show you the core components behind every R Shiny application, and you’ll see just how easy it is to get started.
R Shiny Core Components - What You Need to Get Started
All R Shiny applications are built from two components - ui and server. The former holds the logic for the user interface, while the latter contains all programming logic. When combined, they form the foundation for creating interactive and dynamic applications.
This section will introduce you to these components, explain the reactive programming paradigm, and show you what it takes to build a minimal R Shiny application in minutes.
Build your first R Shiny app in minutes
UI (User Interface)
In simple terms, UI is responsible for defining how your app looks and how users interact with it. It controls the layout, design elements, and input/output components.
A typical Shiny app UI includes elements such as buttons, sliders, text boxes, and charts.
To build a simple UI in R Shiny, refer to the following snippet
So, what’s actually going on here? Let’s break it down:
- The fluidPage() function takes care of responsive design (meaning your app will work on screens of different sizes).
- titlePanel() will display a title above the app.
- sidebarLayout() means you want to structure the UI so that a sidebar is displayed on the left (sidebarPanel()) and the main content is displayed on the right (mainPanel()).
- Both elements of the sidebar layout can have child elements - These are the elements displayed within them. For example, a slider with the ID of number is displayed in the sidebar, and a text box with the ID of result is displayed in the main panel.
Truth be told, the app isn’t the most interesting one for now:

The server function is what’ll make it interesting.
Server
As the name implies, the server handles the app’s logic and data preprocessing. It’s implemented as a function that reacts to user inputs, processes them, and updates the output dynamically.
You’ve seen in the code snippet above how the naming convention of UI elements is xInput and xOutput. These are the input and output elements you can access by their ID property in the server function. For reference, IDs for the elements of our app are number and result.
The code snippet below implements a server function that outputs the selected number from the slider input as text:
This is what the app looks like after implementing the server functionality:
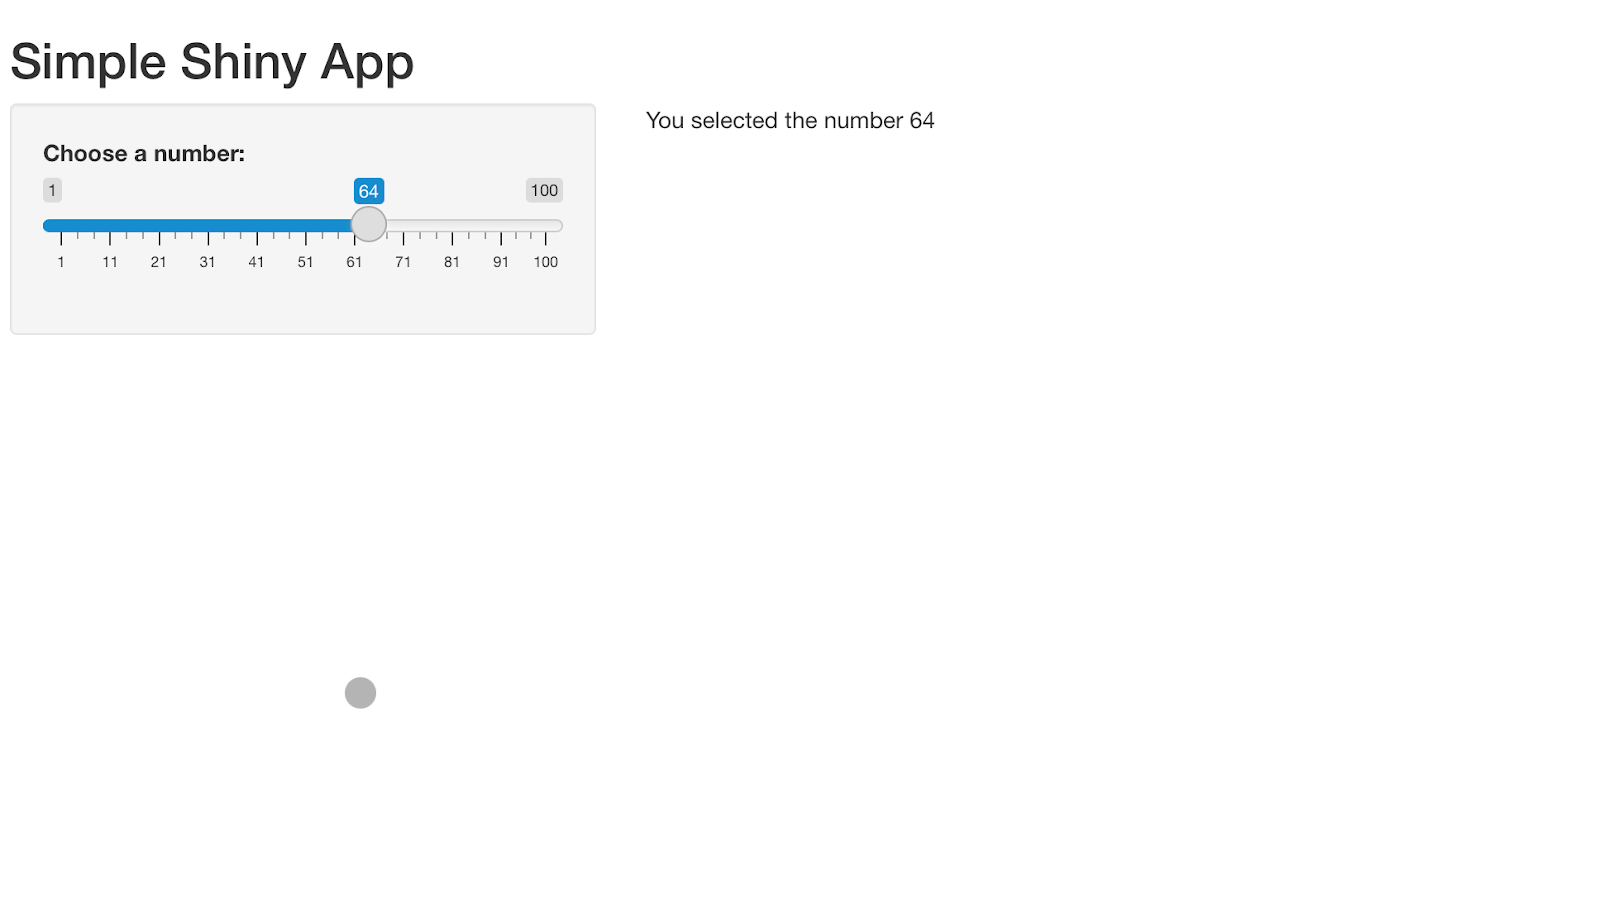
Once again, let’s break down the logic:
- output$result - In here, you’re assigning the results of the renderText() reactive function to an output element with an ID of result.
- renderText() - A reactive function that updates automatically as inputs of your app (e.g., slider) change. As soon as that happens, the code inside {} is executed.
Connecting UI and server
Declaring UI and server functionality isn’t enough - you also have to connect them so Shiny knows what to render and how to behave.
That’s where the shinyApp() function comes in.
It’s called below the UI and server declarations, and it instructs Shiny which UI and which server will be used when the application runs:
And that’s all you need to run your first Shiny app! Up next, we’ll go into the nitty-gritty details of reactivity, ui/server separation, and why it all matters.
Introduction to reactive programming
The beauty of the reactive programming paradigm lies in the fact that the app updates automatically when the input changes.
No, you don’t have to click on a button, and no, you don’t have to write manual event listeners. Sure, you can delay the output event from happening with these two approaches, but that’s not how an R Shiny application behaves by default.
There are 3 reactivity concepts you should differentiate:
- Reactive inputs: User inputs, such as sliders, dropdowns, radio buttons, and similar elements that trigger changes in the app.
- Reactive outputs: App elements that update in response to changes in inputs, such as text outputs, plots, tables, and similar elements.
- Reactive functions: Functions provided by R Shiny that execute reactive expressions and update reactive outputs accordingly.
- Reactive expressions: These handle intermediate calculations and essentially implement the programming logic needed to transform input changes into output outcomes.
You’ve seen how reactivity works in the previous section - a change in the slider value triggers a change in the text output element. The “change” logic is implemented in a reactive expression ({}) of a reactive function (renderText()).
If you want to learn more about R Shiny reactivity, refer to these resources from the Appsilon blog:
- Introduction to R Shiny Reactivity with Hands-on Examples
- Observe Function in R Shiny - How to Implement a Reactive Observer
Shiny’s separation of concerns
Developing and maintaining an application with many pages and components is usually a challenging task.
R Shiny addresses most of the concerns by clearly separating UI from the server logic. You can write both in a single file (as we did above), or you can have each of them in separate files. Further, you can (and should) also isolate larger and repeating components into their own files or modules. More on that later.
In short, this architecture makes developing and maintaining applications easier, especially as your project grows.
Transitioning from static tools to Shiny
If you’re used to static tools like Excel or Jupyter Notebooks, well, Shiny is a whole different animal.
It addresses the shortcomings of the mentioned and similar tools by offering a fully interactive and production-ready solution for applications. Here’s a brief comparison, but remember that we’ll have an in-depth section later on:
- Excel: It offers basic interactivity through formulas and filters, but it struggles with scalability, version control, and complex visualizations. Shiny can transform your Excel files into dynamic web applications that offer better user experience and scale better with increased volumes of data.
- Jupyter Notebooks: Data professionals, especially data scientists, love Jupyter Notebooks as a tool for data exploration. However, they lack interactivity for non-technical users. On the other hand, Shiny apps allow stakeholders to interact with the data without needing to understand the underlying code.
If you’re a decision maker or an executive of a large company, Shiny will save you time by allowing you to focus on the end results, and abstracting everything that happens to get there.
You now have the foundational knowledge of R Shiny, but there’s still a lot of ground to cover, especially if you’re considering using it in your organization. Up next, we’ll go through more concrete reasons why your company should adopt R Shiny.

Shiny vs Jupyter Notebooks
Data professionals, especially data scientists, love Jupyter Notebooks. They are a go-to way to explore data interactively and run/debug code through notebook cells. That being said, notebooks fall short when it comes to being production-ready.
Here’s a list of advantages R Shiny offers when compared to Jupyter Notebooks:
- Interactivity: While the main “selling” point of Jupyter Notebooks is interactivity, it’s nowhere near what Shiny offers. Shiny’s reactive dashboards offer a professional user experience with responsive layouts, meaning non-technical stakeholders will feel right at home.
- Focus on the end result: In short, a Shiny application shows the app, which is the final output of the code. Jupyter Notebooks display both the source code and the output. Some stakeholders might find that off-putting.
- Production readiness: Notebooks are better suited for internal exploration, while Shiny apps are designed for deployment in production environments. Tools like Shiny Server and Posit Connect allow you to deploy your app to users all around the world. There are ways to deploy and share Jupyter Notebooks, but the final product leaves a lot to be desired.
To further illustrate the point, imagine your team of researchers uses Jupyter Notebooks to explore drug efficacy data. As a business user with little to no time to spare, do you want to look at the finished and polished dashboard, or do you want to navigate through the endless sea of intermediary results?
If it’s the former, R Shiny is where it’s at.

Shiny vs Business Intelligence Tools (Tableau, Power BI)
Tableau and PowerBI are both powerful Business Intelligence (BI) platforms with many customization options. However, if you need to control every aspect of your application, it’s hard to beat from-scratch solutions implemented in code.
BI tools offer a significant advantage with their drag-and-drop interfaces, although there’s a similar offering in Shiny. When compared to R Shiny, BI tools fall short in the following areas:
- Flexibility and customization: BI tools have amazing drag-and-drop interfaces and they’re great for most use cases and most people. However, Shiny offers more flexibility to build custom features, incorporate state-of-the-art machine learning models, and use a wider array of visualizations tailored to specific needs.
- Cost: Shiny is open-source, while almost all BI tools (Tableau and Power BI included) require licensing, which can cost you a fair chunk of change monthly. Adding insult to injury, every developer will need their own license, so the costs quickly add up, especially in large teams.
- More advanced features: In BI tools like Tableau and Power BI, you have to wait and rely on developers to implement new features, like state-of-the-art machine learning models, for example. In R Shiny, this is available from day one since you have access to a wide range of R’s third-party packages.
Read the following articles to explore the Shiny vs BI tools comparison further:
- Tableau vs. R Shiny: Which Excel Alternative Is Right For You?
- Power BI vs R Shiny: Two Popular Excel Alternatives Compared
- Choosing the Right Data Visualization Tool: R Shiny, PowerBI, or Spotfire

Shiny vs Static Reporting Tools (Quarto, RMarkdown)
Static reporting tools such as Quarto and RMarkdown have their place and are great for generating reports.
When compared to R Shiny, static reporting tools severely lack in three key areas:
- Interactivity: Static reports are generated once and they don’t allow users to interact with the data. Going through these reports is boring and involves a lot of searching and scrolling. With Shiny, you gain the ability to include interactive charts and tables that update instantly as you change the filter values.
- Real-time capabilities: If the data changes, reports have to be regenerated. The report creator must know in advance which key features a report must include. On the other hand, R Shiny apps allow the end user to filter, explore, and analyze data on the fly.
- User engagement: There’s nothing engaging about static reports. It’s one uninteresting chart or table after another. Shiny makes your data engaging by allowing users to control inputs, adjust parameters, and view updated results instantly. It’s a go-to tool for decision-making processes.
To learn more about static reporting tools like Quarto and RMarkdown, read the following articles:
- Interactive Quarto Reports with Shiny using {shiny.i18n}
- R Markdown Reporting Best Practices
- R Markdown Tips: Code, Images, Comments, Tables, and More
What Your Team Needs to Get Started with R Shiny
By now, you know exactly what R Shiny is and how it outperforms its competitors.
In this section, we’ll dive deep into every aspect your team needs to get started with R Shiny. After this section, no stone will be left unturned, and you’ll understand just how much effort it takes to adopt R in your organization.
Basic requirements
There are 3 must-know requirements before adopting R Shiny at a large scale in your organization. These are the programming language itself, reactive programming, and minimal knowledge of web technologies.
The last one is optional but will make everything much easier.
Fundamental knowledge of the R programming language
Shiny is built on R, so a foundational understanding of the language is essential.
Your development teams must be comfortable writing R scripts, working with its data structures such as vectors, lists, and data frames, and using popular packages such as dplyr and ggplot2 for data manipulation and visualization.
That’s the bare minimum.
If your team is already proficient in another programming language, such as Python, transitioning to R will be much smoother than if they’re starting from scratch. Make sure to provide adequate training so everyone understands the fundamentals.
Familiarity with reactive programming
Every aspect of Shiny’s interactivity is dependent on reactive programming. In plain English, it’s a paradigm that updates outputs dynamically in response to changes in inputs.
Truth be told, reactive programming isn’t a hard requirement, as you can build basic apps without it, but that’s about as far as you’ll get. If you want to build anything usable, key concepts such as reactivity, observers, and reactive expressions shouldn’t feel like a foreign language.
These articles on our blog are detailed enough to get you started, provided you have a fundamental understanding of R:
- Introduction to R Shiny Reactivity with Hands-on Examples
- Observe Function in R Shiny - How to Implement a Reactive Observer
Basics of web technologies
Web technologies such as HTML, CSS, and JavaScript are not required to build Shiny apps.
However, they’ll take your app to a whole new level. CSS (or SCSS) is usually used to apply custom stylesheets to dashboards and is a go-to solution to make it visually appealing. JavaScript is widely used to extend the functionality of R Shiny. You can even learn a specific frontend framework (like React) and use it in your Shiny apps.
That being said, it’s an entirely new language for your team to learn. If they’re just starting out, it might be best to stick with R if possible.
Consider these articles to supplement your R Shiny knowledge:
- How to Use CSS to Style Your R Shiny Dashboards
- How to Use TailwindCSS in Shiny
- How to Make Your CSS Systematically Awesome - SASS Tutorial in R
- How to Develop Robust and Maintainable JavaScript Code Within a Shiny Application
Recommended tools to get started with R and R Shiny
Writing code in a company environment involves a few steps—actually writing the code, version controlling it, and deployment. It’s an iterative process.
This section covers everything you need to write maintainable and scalable R code in an enterprise environment.
IDE
Code is just a collection of text, meaning you can use a notepad and call it a day. But that’s far from the best developer experience.
Let’s go over a couple of Integrated Development Environments (IDEs) we recommend.
RStudio
The most familiar IDE for R is by far RStudio. It offers extensive support for R, Quarto, RMarkdown, and most importantly, R Shiny.
This IDE allows you to run code line by line and examine variables and plots in separate panels, all while having instant access to the console. RStudio also packs some Shiny-specific functionalities, such as Shiny viewer, which allows you to test your apps locally using the built-in preview window.
Overall, it’s the best offering for R development as of 2025, and it’s likely to stay that way in the future.
That being said, RStudio can feel overwhelming to newcomers. Refer to our article on best shortcuts and tips to smooth out the learning curve.
Visual Studio Code
VSCode is a general-purpose text editor that’s not specific to R. You can use it to write code in any programming language.
So, why are we including it here?
VSCode has thousands of installable plugins and excellent documentation. This official page will show you exactly what you need to get started writing R in VSCode. There’s also an official plugin for R Shiny!
With a bit of effort and manual labor, VSCode can cover 90% of RStudio functionality without feeling overwhelming. If your team already has programming experience, chances are they’re familiar with VSCode and don’t want to switch.
Positron
If your team likes VSCode, they’ll love Positron.
It’s a next-gen data science IDE made by the creators of RStudio. Technically speaking, it’s a fork of VSCode, so existing users will feel right at home. It’s currently in beta, so some features you’re accustomed to in VSCode might not work.
Positron has many of the bells and whistles RStudio has—variable inspector, data frame viewer, plot panel—just to name a few. Everything comes configured out of the box, so you can start coding right away.
If you’re interested in learning more about Positron, we’ve devoted an entire article to it:
Version control with Git
In an enterprise environment, Shiny apps are rarely written by a single developer.
Even if that’s the case, it’s not an excuse not to implement version control. It’s the only way to track updates to your app and revert to a previous working version if needed. But where version control becomes a strict necessity is when multiple developers work on the same codebase.
Here are a couple of concrete version control benefits:
- Version history: You can track changes to your app’s codebase and roll back if needed.
- Collaboration: Multiple developers can work on the same project without conflicts.
- Branching: Developers can experiment with new features in isolated branches while leaving the main branch intact. Once a new feature is ready, it can be easily merged into the main branch.
When paired with platforms like GitHub or GitLab for repository hosting, you also unlock the possibility of automated deployments with CI/CD pipelines.
Deployment with Posit Connect or ShinyProxy
Speaking of deployment, let’s explore two common options here. There’s a dedicated section coming later in the article.
Posit Connect is a commercial product by Posit that makes Shiny app deployment a breeze. It also packs features for user authentication and app monitoring, which will lift a lot of weight from the shoulders of your development team.
You can deploy Shiny apps to Posit Connect straight from an IDE like RStudio or through the shell. Read our detailed article to find out how.
ShinyProxy is an open-source alternative for deploying Shiny apps. It uses Docker to handle deployment, so it’s more suitable for teams with technical expertise in Linux environments and containerization. The increased technical requirements come with the benefit of increased scalability, as you can run multiple Shiny apps on the same server.
To conclude, use Posit Connect if you value ease of use, or use ShinyProxy for cost-sensitive situations when your team has the necessary knowledge.
If you want more info on each, our ShinyProxy vs Posit Connect article has you covered.
R Shiny Tips and Best Practices
Working with a new technology like R and R Shiny can - and will - be challenging.
There’s not a lot your team can do about it. In essence, it always boils down to investing many man hours to become proficient with the technologies. That being said, there are some best practices your team can follow to ensure your apps are functional, efficient, maintainable, and user-friendly.
In this section, we bring you 5 best practices from our experience working with Fortune 500 companies.
Work iteratively
As with anything, aim to start simple and add features incrementally.
When your team first gets started with a new technology such as R Shiny, it’s tempting to include all the desired features upfront. We found that a better approach is to begin with a minimal viable product (MVP) and add complexity incrementally.
Starting small will allow your team to focus on the core functionality first.
For example, if your team is building a drug development dashboard, they should start by displaying one (or a few) static plots and tables first. From there, it’s easy to add interactivity through filters and sliders. And from there, it’s easy to enrich the plots with data drilldowns. You get the idea.
Once the app is functional, listen to user feedback to prioritize new features.
To conclude, with an iterative approach you can somewhat guarantee a fast delivery of a functional app and thus reduce the risk of overwhelming your team with unnecessary complexity in the early app development stages.
Use version control
We’ve mentioned this a couple of times already, but we can’t stress enough how important proper version control is from day one.
In development teams, version control systems like Git allow your employees to collaborate and work on the same project while maintaining a clean codebase.
In essence, Git allows you to:
- Track changes: Every change to your app’s code is logged, which makes it easy to identify the point at which bugs were introduced. You can also roll back to a previous app version if needed.
- Collaborate: Platforms like GitHub and GitLab allow multiple developers to work on the same project without overwriting each other’s code. Features such as pull requests and code reviews ensure new features are up to standard before merging them into the main branch.
- Experiment: Branches in a repository can be used to test new features or refactor existing code without affecting the main codebase. Once the changes are tested and the team is satisfied with the results, they can merge the branch into the main branch.
Another crucial aspect of proper version control is meaningful commit messages. They should briefly describe what has changed since the last commit. From our experience, they’re a huge time saver when you want to roll back to an application version from 6 months ago. Without meaningful messages, you’d have to search through commit history manually, and with them, you can get a rough estimate at the very least.
Write clean and maintainable code
Use linters and formatters to enforce code standards.
In the long run, reliable and well-structured code is easier to debug, extend, and collaborate on. It also ensures smooth handover if the app will be maintained by a different team in the future.
If you’re working in a highly regulated industry like pharma, good documentation and standardized formatting might even be a requirement for regulatory submissions.
Read more about Good Software Development Practices (GSEP) for FDA/EMA submissions.
These 3 guidelines will take your team a long way:
- Use linters: R tools like lintr can automatically check your code for inconsistent formatting and adherence to style guidelines. Use it from day one to avoid creating a mess you’ll regret later.
- Adopt formatters: Formatters like styler ensure consistent indentation, spacing, and line breaks across your R scripts. Sure, your code will work without them, but consistency is the name of the game.
- Organize your code: If you expect your app to grow, separate logic into modules and functions. Also, keep UI and server components tidy in separate files. A good practice is to create a models folder for reusable components or use Rhino to eliminate any guesswork. More on Rhino in a separate section.
Following these 3 guidelines will enforce code standards across the entire development team. In the long run, it ensures your app is robust, maintainable, and easy to review.
Test your application
As your team adds functionalities to a Shiny app, they should also write tests for it.
Testing is crucial to ensure the app works as intended, and it becomes even more important as the app grows in complexity. You want to make sure new functionality works as advertised, but you also want to be certain none of the already implemented functionality is broken.
Your development team should aim to combine automated tests with manual testing - that’s our go-to strategy to ensure a seamless user experience.
Some R packages like shinytest even allow you to record user interactions and replay them to verify the app behaves correctly.
If you want to learn more about tests in R Shiny, and the different testing tools you have available, these two articles are a good starting point:
- shinytest2 vs Cypress: End-to-End (E2E) Testing in Shiny
- How to Write Tests with shiny::testServer Similar to shinytest2
Monitor usage and adoption
Deploying your app is just the beginning.
To ensure its success in the long run, you should monitor how users interact with it and use this data to guide improvements. You can go as simple as plugging Google Analytics into your Shiny app, or develop a custom solution that tracks and monitors data that’s most relevant to you.
The most common metrics you’ll likely want to follow are session duration, most-used features, and user demographics. Based on these, you can tweak the existing functionality of the app if you see a high bounce rate or implement new features by collecting feedback through the app in its early stages.
There’s a handful of tools and packages you can use to monitor user adoption. We wrote several articles on the topic, so feel free to skim over them:
- Top 3 Tools to Monitor User Adoption in R Shiny
- {shiny.telemetry}: Enhanced User Behavior Analytics in R/Shiny Dashboards
Advanced R Shiny Concepts
Now it’s time to talk business.
We’ve covered the fundamentals of Shiny so far, and you know exactly what your team needs to build impressive apps while following best practices. In this section, we’ll discuss a couple of advanced features like reusable components, advanced styling, and best strategies for code organization.
Modules: Build reusable UI and Server components
One of the fundamental rules of writing code is DRY - Don’t Repeat Yourself.
Simply put, don’t repeat the same programming in multiple places. Instead, write a parameterized function and call it when needed. Modules serve a similar purpose in R Shiny, but with a Shiny-specific twist.
Modules in R Shiny allow you to write reusable UI and server logic into self-contained components. This way, your codebase is more organized and maintainable. Your team should use them because they both reduce code duplication and simplify maintenance down the road.
An R Shiny module consists of two parts:
- UI function: Defines the user interface.
- Server function: Handles the programming logic.
The structure is similar to the structure of app.R, with the only difference being that UI is now explicitly a function. Once declared, you can call them anywhere in your application.
To get started with R Shiny modules, read the following two articles:
- R Shiny Modules: How to Create Your First R Shiny Module
- Working With Legacy Code: Extending Shiny Modules with the Sprout Technique and Test Driven Development
If you’re looking for guidance on using Box modules in Rhino (explained later), this is a good starting point:
Code organization: Strategies for structuring R Shiny apps
Correct code organization is the key to long-term maintainability as your app grows.
Without it, your team will constantly be refactoring and reorganizing old code while implementing new features. Not a great place to be, and a huge time waste.
By applying a simple divide and conquer strategy, your team can split the application code into separate files for UI, server, and global settings. To do so, they can create subdirectories, for example, modules/, helpers/, and data/, just to name a few.
They can also use different application frameworks such as Rhino or Golem to ensure consistent file and folder structure.
Read more: {rhino} vs {golem} vs {leprechaun}: Which R/Shiny Library is Right for You?
But generally speaking, even declaring utility scripts will take your team a long way, as the code logic isn’t repeated all over the place and the entry points of your application remain clean and tidy.
Custom components: Expand Shiny with JavaScript
Shiny can do many things out of the box, but there are areas where it falls short.
Sometimes you need to bring out the big guns. In the context of R Shiny, that’s JavaScript. It’s yet another programming language that unlocks advanced options, such as near-instant user interaction, browser features, and custom server-client communication, just to name a few.
While working with Fortune 500 companies, we mostly saw two scenarios when they tried using JavaScript in Shiny:
- Teams don’t know they can use JavaScript in R Shiny.
- Teams do know of the possibility, but the existing implementation is a pure mess.
Now, how you should go about the implementation is out of the scope of this article, but we have a couple of resources to get you started:
- (YouTube) Getting the most out of your shiny apps: Leveraging web technologies in Shiny
- How to Develop Robust and Maintainable JavaScript Code Within a Shiny Application
For even more advanced users, it’s worth knowing that you can use JavaScript frontend frameworks in R Shiny. Take a look at Appsilon’s shiny.react package.
Styling with SCSS: Advanced styling techniques
Most frontend developers don’t write CSS directly nowadays.
Instead, they use something like SCSS - an extension of CSS that enables more powerful styling with variables, nesting, and mixins. This set of SCSS files is then compiled into a single CSS file that’s used in an R Shiny application. So, technically, the app is still leveraging CSS, but the developer has a much better experience writing SCSS.
Here are the concrete benefits SCSS offers over CSS in the context of R Shiny:
- Nesting: SCSS allows nesting of selectors, which makes the code more structured. It also reflects the HTML element hierarchy.
- Variables: SCSS allows your team to use variables for colors, fonts, and other properties. This improves consistency and maintainability.
- Mixins: With mixins, your team can reuse chunks of styles across your project, reducing code duplication.
- Inheritance: SCSS supports inheritance with the @extend directive, which enables shared styles across multiple selectors.
- Functions and math: SCSS comes with built-in functions and math operations, so your team can write dynamic and calculated styles.
If you’re eager to learn more about SCSS in R, we have a full-length article for you:
Custom tables: Interactivity with the DT package
Tables are usually less interactive than charts, but it doesn’t have to be this way.
Luckily, there are plenty of third-party R packages specifically designed to work with table data. Even better, most of them have dedicated functions for declaring UI elements and rendering output through the server.
One of the best R Shiny packages for visualizing table data is DT, and it has superb Shiny support. It’s one of the most often used table packages here at Appsilon, and we love it for the following reasons:
- Excellent sorting, filtering, and pagination support.
- Has customizable styling and functionality with CSS and JavaScript.
- Integrates well with Shiny inputs and provides real-time interactivity.
So, the next time your team needs to present data in table format, just remember R Shiny provides plenty of options.
Read our in-depth articles to find the best use-cases for specific table packages:
- Top R Packages for Visualizing Table Data - Make Stunning Tables in Minutes
- Introduction to Clinical Tables with the {gt} Package
Advanced testing: Look no further than Cypress
Cypress is a JavaScript-based end-to-end testing framework you can use in Shiny to validate the functionality of your app by simulating real user interactions.
It’s a Node.js package released back in 2015. Since then, it has become a staple of the developer’s toolbox. It can test everything from basic websites to complex web applications. Truth be told, it’s not specifically designed to test R Shiny apps, but it’s technology-agnostic, so it doesn’t really matter.
Compared to the alternatives, Cypress offers the following advantages:
- Allows almost any kind of element selection.
- Emulates human interaction.
- Is straightforward to write robust tests.
- Allows you to integrate test execution and do time travel (checking before-after states).
If you plan to use Cypress (which we highly recommend), just remember it’s dependent on Node.js and requires you to write tests in JavaScript. Worst-case scenario, your team will have to learn another programming language.
To learn more about Cypress and see how it compares to the alternatives, read the following two articles:
- Automating End-to-End Cypress Tests in Rhino: A Guide to Seamless UI Testing for Shiny Apps
- shinytest2 vs Cypress: End-to-End (E2E) Testing in Shiny
R Shiny Ecosystem - Must-Know Packages
So far, we’ve mostly discussed R Shiny in isolation, as a standalone package for writing web apps.
In reality, Shiny rarely works in isolation. Your team will typically use a much broader ecosystem of R packages that integrate seamlessly with Shiny. This ecosystem is what allows for handling the entire data analysis lifecycle – from data wrangling to visualization and reporting.
We’ll first discuss the general benefits of this ecosystem and then dive into our cherry-picked list of packages.
Benefits of R’s ecosystem
The main benefit of the ecosystem is that it’s a one-stop shop.
Your team can do any data-related task directly in R. From gathering and preprocessing data to training machine learning models and visualizing results, R has a convenient package that can help them out. Most packages on the right end of this pipeline integrate well with Shiny, meaning there are predefined functions to render the outputs interactively in your apps.
One of the most popular ecosystems in R is the tidyverse ecosystem. It’s a collection of packages designed for modern and streamlined data manipulation, visualization, and analysis. Tidyverse includes packages such as dplyr, tidyr, and ggplot2, just to name a couple. All of them have a consistent syntax and philosophy that makes data workflows intuitive and efficient.
To learn more about the tidyverse, we recommend going through the official documentation page.
Most popular R packages your team will use daily
There are thousands of R packages available on CRAN alone, so hand-picking only a few of them is a challenging task.
In general, we find these 10 to be the ones Shiny teams most frequently rely on, as they cover a wide array of functionalities used all the time in web applications:
- dplyr: A data manipulation package that simplifies filtering, summarizing, and transforming datasets with an intuitive and beginner-friendly syntax.
- tidyr: Ideal for reshaping and tidying data, ensuring it’s ready for analysis or visualization in Shiny.
- ggplot2: A one-stop shop visualization package for creating high-quality static plots, seamlessly integrated into Shiny apps.
- plotly: Allows you to create interactive and highly customizable plots that enhance user engagement in dashboards.
- leaflet: A package for integrating dynamic, interactive maps into Shiny apps, perfect for geospatial data.
- DT: Allows you to add interactive, customizable data tables that support features like filtering, sorting, and exporting directly in your app.
- stringr: Provides simple and consistent tools for string manipulation, useful for cleaning and formatting user inputs or text data.
- purrr: Simplifies functional programming in R, making it easy to apply operations across lists and other complex data structures.
- lubridate: A go-to package for working with dates and times. It’s a straightforward solution for filtering or aggregating time-based data.
- shinyWidgets: Extends Shiny’s user interface components with enhanced inputs like sliders, toggle switches, and dropdown menus.
To dive deeper into these, we’ve prepared a list of articles you can go through:
- How to Analyze Data with R: A Complete Beginner Guide to dplyr
- How to Make Stunning Bar Charts in R: A Complete Guide with ggplot2
- Overview of the Python Dash Framework from Plotly for Building Dashboards
- How to Make Stunning Geomaps in R: A Complete Guide with Leaflet
- Top R Packages for Visualizing Table Data - Make Stunning Tables in Minutes
- R lubridate: How To Efficiently Work With Dates and Times in R
Popular R tools that complement Shiny
Shiny is powerful by itself, but what takes it to another level is combining it with other R packages designed for specific purposes.
These tools enable additional capabilities, such as creating APIs to serve as a backend for the Shiny app or adding functionality to export static reports. Two R packages are particularly interesting here:
- Plumber: A package that turns R code into RESTful APIs. If your Shiny app communicates with external sources and/or databases, it makes sense to create an API first as a separation from Shiny logic. For example, you can create a Plumber API that incorporates functionality for database communication (CRUD-like operations) and returns preprocessed data to Shiny when the input changes.
- RMarkdown: It’s one of the go-to packages for producing high-quality static reports. Your team can combine it with Shiny to allow users to interact with the app to filter data, and then generate a downloadable PDF/HTML report summarizing their selections and results.
Learn more about these:
- How to Make an R REST API: A Beginner's Guide to Plumber
- R Plumber: How to Craft Error Responses that Speak Fluent HTTP
- R Markdown Reporting Best Practices
- R Markdown Tips: Code, Images, Comments, Tables, and more
To conclude, Shiny doesn’t live in isolation. It’s best to combine it with a broader R ecosystem to take full advantage of data processing capabilities. This section showed you the best packages to get started.
Meet Rhino: Appsilon’s Framework for Shiny
Over the years of working with Fortune 500 companies, we’ve developed a gold standard for creating, writing, and maintaining R Shiny apps.
All of that is packaged into a robust R package called Rhino. In essence, it’s a robust framework that allows your team to create Shiny apps like a full-stack software engineer. It implements and follows best software engineering practices, modularizes your code, tests it well, makes the UI beautiful, and considers user adoption from the very beginning.
Rhino is a go-to way to bring R Shiny apps to enterprise.
In this section, we’ll give you an overview of its capabilities, modular architecture, pre-configured CI/CD pipelines, and much more.
Modular Architecture for Scalable Applications
Modular architecture enforces a clean separation of concerns. In other words, the Shiny app’s code is split into logical, reusable modules for components.
We’ve opted for a modular approach because a monolithic structure becomes impossible to manage as the application grows. Our approach, on the other hand, encapsulates application functionalities in small and testable units. Each module handles specific tasks, such as rendering a chart or managing inputs. The app is easier to maintain and scale as an end result, especially when larger teams work on it.
Rhino achieves this by providing a predefined project structure.
For example, the app/logic folder is used to define every bit of programming logic not tied to R Shiny. The app/view folder contains reusable UI components that are part of the Shiny app. There’s a dedicated tests folder that contains all unit and E2E tests. As usual, app.R is the entry point of your application.
It’s also worth mentioning that Rhino uses the {box} package to divide your code into logical modules. We found this to be the best approach in treating each kind of functionality in an isolated way.
There are many nuances here that result from best practices obtained from years of experience working with Fortune 500 companies. This architecture will allow your team to collaborate efficiently, add new features, and maintain existing features in an enterprise environment.
Pre-configured CI/CD Pipelines, Linting, and Dependency Management
Since Rhino is built with enterprise-grade development workflows in mind, it has to pack a ton of useful features that make developers' lives easier. Features like type checking, linting, and pre-configured CI/CD can automate development tasks and enforce coding standards.
Let’s discuss each and see how Rhino fits in:
- CI/CD pipelines: Rhino comes with pre-configured CI/CD pipelines that integrate with popular platforms such as GitHub Actions. In short, these pipelines allow your developers to automate testing, code quality checks, and deployments to production environments. Validations are run automatically as soon as an application update is pushed.
- Code linting: The lintr package allows Rhino to enforce clean and reusable code. By using it, your team can adhere to consistent coding practices, which both reduces errors and improves maintainability in the long run. For example, lintr can flag unused imports or poorly named variables, so your team can easily spot and fix inconsistencies.
- Dependency management: Rhino relies on the renv package to manage your project dependencies and to ensure the project runs as intended in other environments, such as another developer’s machine or a production server.
Where to Learn More About Rhino
Rhino is our pride and joy, so naturally, we have plenty of learning resources to get you started:
- Official Documentation Page
- Rhino Frequently Asked Questions
- Rhino R Package Tutorial: Build Your First Rhino App
- {rhino} vs {golem} vs {leprechaun}: Which R/Shiny Library is Right for You?
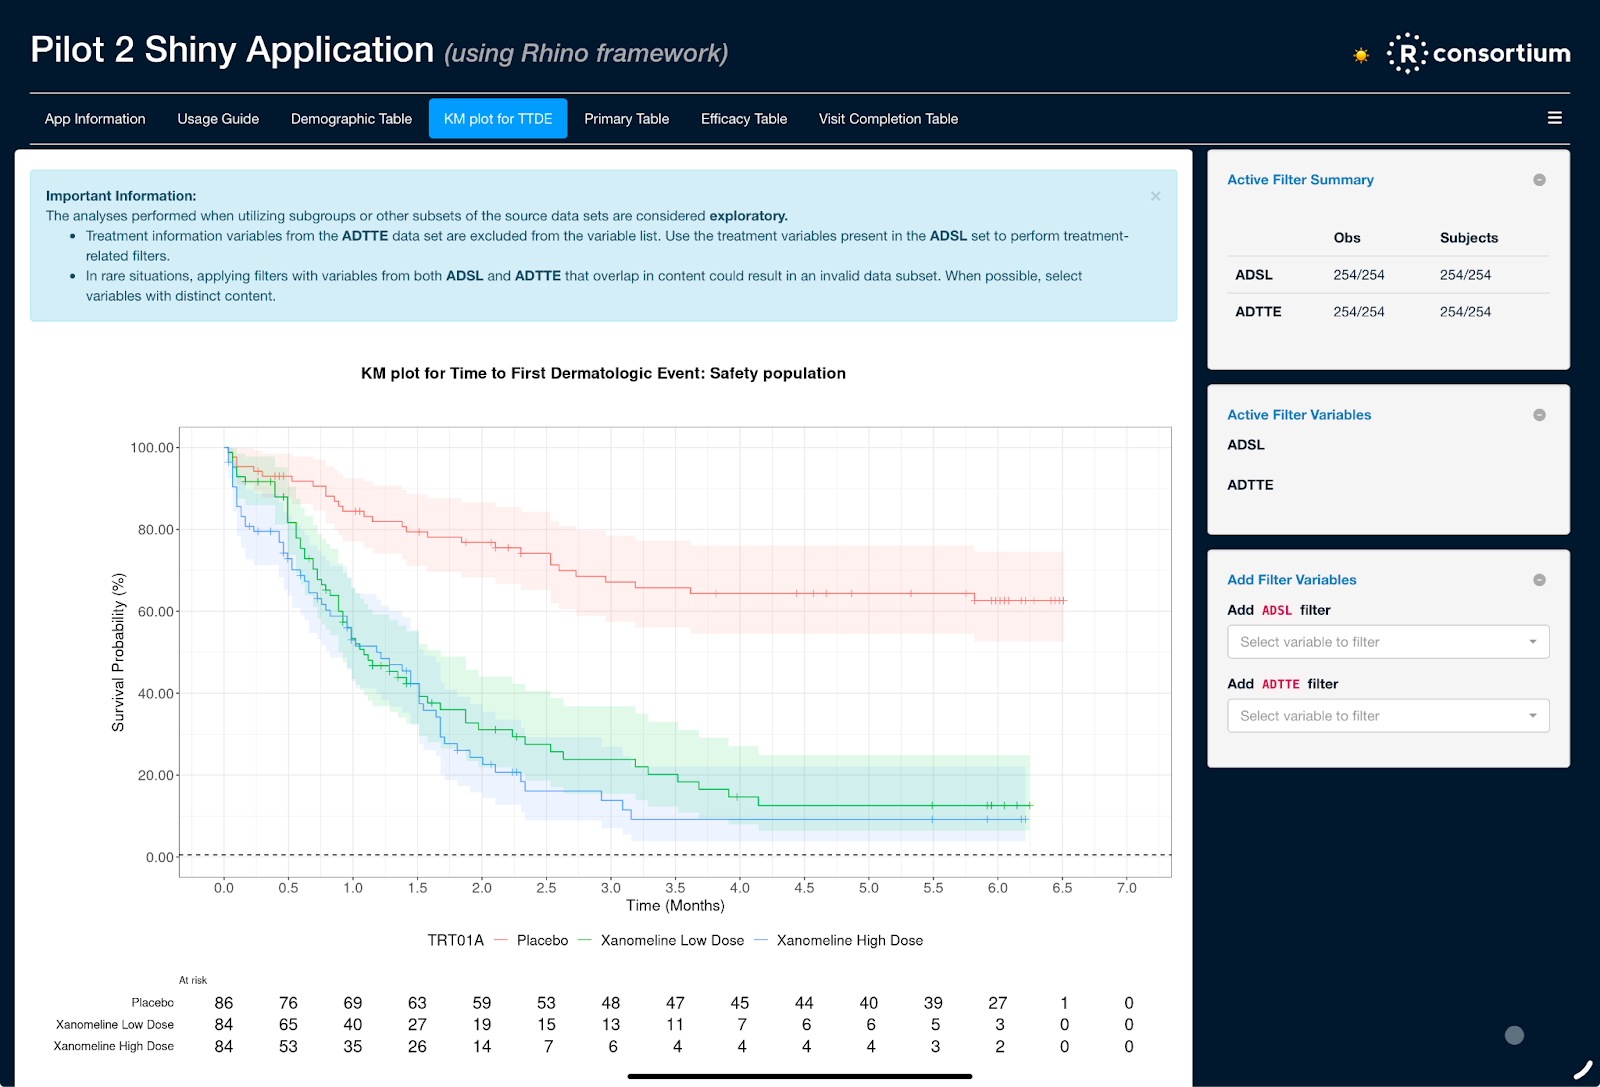
- Advancing FDA Clinical Trial Submissions with R: Reproducing the R Submissions Pilot 2 Shiny App Using Rhino
- Automating End-to-End Cypress Tests in Rhino: A Guide to Seamless UI Testing for Shiny Apps
- Redesigning Dashboards with Shiny and Rhino: World Bank's Carbon Pricing
R Shiny Deployment and Hosting Options
Once your team is out of the initial development or PoC phase, it’s time to share the work with the rest of the company. Or the entire world!
That’s when deploying an R Shiny application becomes crucial. There are plenty of deployment methods to choose from, and the one you choose will depend on factors like security requirements, scalability needs, budgets, and technical expertise.
In this section, we’ll go through a couple of deployment options for R Shiny apps so you can decide which is best for your organization.
Posit Connect
Formerly known as RStudio Connect, Posit Connect is a good all-around platform designed for enterprise-grade hosting of Shiny applications, RMarkdown reports, Plumber APIs, and other R-based projects. So, it’s not just for Shiny.
It emphasizes security and ease of use.
Posit Connect has 3 key features most enterprises find a must-have:
- Secure access control: Fine-grained access control allows you to restrict application access to specific individuals, groups, or teams. If your company handles sensitive data, which most pharma and life science companies do, this feature is a must-have.
- Task scheduling: Posit Connect allows you to schedule tasks such as data refresh, report generation, and similar, all through predefined intervals.
- Centralized management: Your team can host multiple applications (R-based) on a single platform, which provides administrators with centralized monitoring and logging.
To conclude, if your organization focuses on security, compliance, and ease of use, Posit Connect is a superb deployment option.
For example, if you’re running a pharmaceutical company and want to host apps for clinical trial monitoring and regulatory reporting, Posit Connect can do that while ensuring that only authorized stakeholders can access sensitive data.
Learn more about Posit Connect:
- Deploying to RStudio Connect: A Beginner's Guide
- How to Deploy RStudio (Posit) Connect into Local Kubernetes Cluster
ShinyProxy
If your company is looking for an open-source platform for deploying data science applications, look no further than ShinyProxy.
Even though it has “Shiny” in the name, you can use the platform to deploy applications written in other frameworks and languages, such as Dash, Streamlit, Jupyter Notebooks, and even IDEs such as RStudio and VSCode. See the full list of supported applications.
ShinyProxy has a couple of compelling reasons you should use it:
- Open source: It’s released under the Apache License with source code available on GitHub. It uses a mature enterprise JVM technology bundled as a Spring Boot web application.
- Apps are Docker-based: When an application is deployed on ShinyProxy, it’s bundled and installed into a Docker image. Every time the user runs it, a container spins up and serves the application. You can also configure it to pre-initialize and share containers between users.
To summarize, if your organization is looking for an open-source and cost-effective solution to deploy Shiny applications (and more), ShinyProxy might be all you need.
Learn more about ShinyProxy on the Appsilon blog:
- ShinyProxy 3.1.1: What’s New and How It Improves Scalability and Performance of Your Shiny Applications
- ShinyProxy vs Posit Connect: Benchmark Test for Scaling Shiny Apps
Cloud providers: AWS, Azure, and GCP
In 2025, most companies have fully transitioned to the cloud or are in the process of doing so.
There’s a good reason for it — your team doesn’t have to guess the infrastructure requirements, go through the horror of manual setup, nor perform regular maintenance. Everything is done and managed for you in a pay-as-you-go environment.
So naturally, big companies want to migrate their R Shiny apps to the cloud as well. The key features and options we’ll describe are cloud provider agnostic, but the naming conventions may differ between them.
Here are 2 deployment options for taking R Shiny to the cloud:
- Virtual machines: Scalable compute instances (e.g., AWS EC2, Azure Virtual Machines, Google Compute Engine) can be used to host R Shiny apps or even Shiny Server/ShinyProxy.
- Containerization: You can Dockerize your Shiny apps (more on that in the following section) and deploy them on container orchestration platforms like Amazon ECS, Azure Kubernetes Service (AKS), or Google Kubernetes Engine (GKE).
Whichever route you choose, you’ll benefit from general cloud scalability (being able to scale resources up/down based on demand), integration (e.g., connecting to database/machine learning services running on the same provider), and global availability (multi-region application deployment).
All cloud providers do a great job with high availability and deployment options that can be tailored to work with Shiny. Stick to the one you already use — you won’t gain anything by switching.
Containerization with Docker
Docker is the gold standard for containerizing R Shiny applications. It ensures consistency and portability across different deployment environments.
It essentially packages the app and all of its dependencies into a single, self-contained unit, which means anyone can take it and reproduce your local environment exactly. That’s a godsend when it comes to deployment.
Containerizing a Shiny app involves creating a Dockerfile in which your team has to specify build and run instructions. For example, they can take an existing image, such as rocker/shiny, install additional system dependencies, copy the entire Shiny application, expose a port, and run the app on that port.
In production environments, Docker is often used in combination with orchestration tools such as Kubernetes or Docker Swarm for managing multiple containers. With these, your team can deploy a single or a cluster of Shiny applications and automatically load balance traffic across them.
As mentioned in the previous section, Dockerized Shiny applications integrate well with all cloud providers that have some sort of Kubernetes engine you can provision.
Learn more about Dockerizing R Shiny apps:
- R Shiny Docker: How To Run Shiny Apps in a Docker Container
- Docker vs. Podman vs. Singularity: Which Containerization Platform is Best for R Shiny?
ShinyLive: How to Run Shiny Apps as Static Websites
The goal of ShinyLive is simple: allow Shiny apps to run directly in the web browser without the need for a backend server.
In plain English, this means you can deploy a Shiny application as a static site and host it on a free environment such as GitHub Pages. To achieve this, ShinyLive leverages WebAssembly via the webR project.
The shinylive R package allows your team of developers to export their Shiny applications from local files to a directory that can be hosted on a static web server. There’s also a ShinyLive Quarto extension that lets your team write Shiny applications in Quarto web documents and slides, which are then translated into ShinyLive applications.
ShinyLive is best suited for simple use cases, such as:
- Public dashboards: Think of dashboards that will be used by a broad population. Why? Because you don’t have to worry about backend hosting costs or server scaling. The entire application is just one static website, and as such, it can be hosted on many platforms for free.
- Prototyping and demonstration: If your project is in its infancy and you want a quick solution to share a PoC with stakeholders, ShinyLive might be a good way to go.
Limitations of ShinyLive
The previous section might have left you with the impression that ShinyLive is some sort of be-all, end-all wizardry.
It’s not.
It does offer compelling advantages, but it has some severe limitations that make it a no-go for most companies and larger projects:
- Limited access to external resources: ShinyLive apps run on the client side, meaning they have very limited (if any) capabilities to interact with external resources, such as APIs and databases. If your app requires any sort of backend integration, traditional Shiny hosting (described earlier) is the way to go.
- Performance constraints: App performance depends on the user’s device. If your ShinyLive app does any sort of computationally intensive task, the performance will suffer since there’s no server-side processing.
- No secrets: Application data and code are sent to the browser, which means the user can inspect them with ease.
That’s just a handful of limitations, but you get the idea—ShinyLive is not designed to work in professional or enterprise environments.
It’s best suited as a PoC demonstration platform.
Learn more about ShinyLive
We recently wrote an entire article on ShinyLive, but for Python’s version of Shiny. Feel free to check it out, as the general idea and benefits transfer to R:
Real-World Examples and Case Studies
We’ve covered a lot of ground in this article, but we haven’t yet discussed anything practical.
In this section, you’ll see some of our best R Shiny projects, including dashboards for the life sciences and pharmaceutical sectors. After this section, you’ll have a crystal-clear picture of what R Shiny can do.
Our FDA Submissions Dashboard is intended for a pilot submission to the FDA, consisting of a Shiny application:
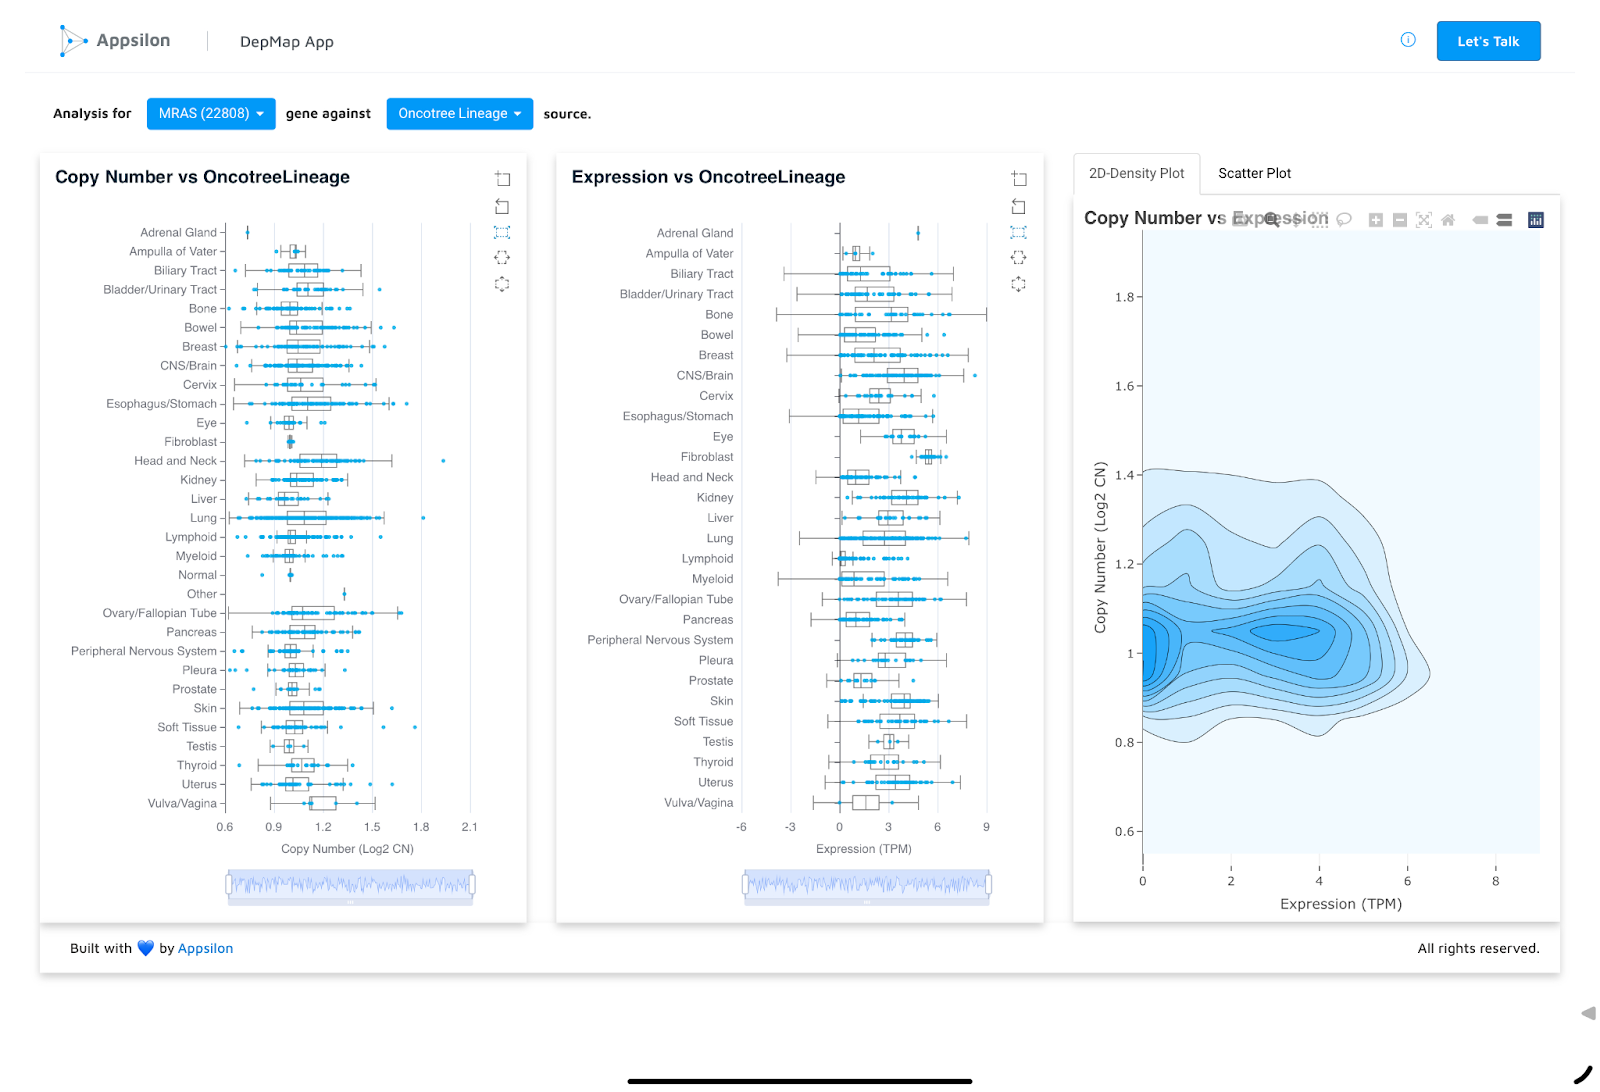
The DeepMap application explores relationships between gene expressions and copy number variation. It uses the DepMap Public 23Q2 dataset from the DepMap project:
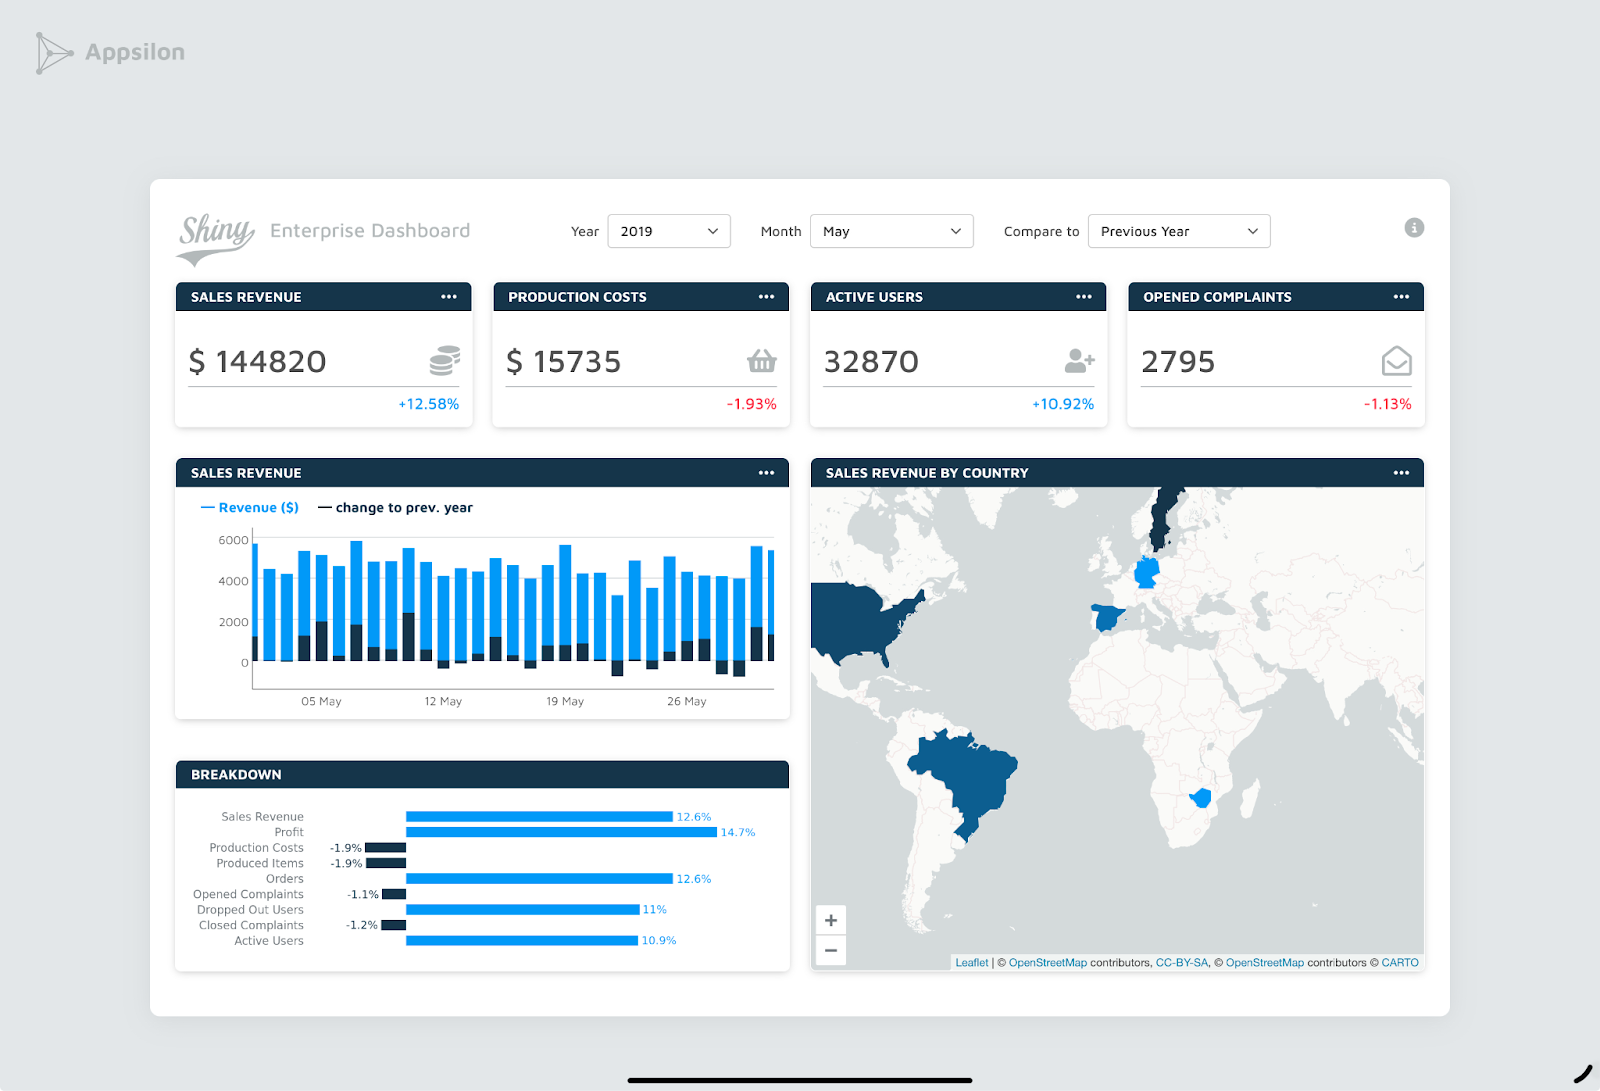
Our Enterprise Shiny dashboard is a prime example of how good modern R Shiny applications can look when you have a couple of superb engineers and a day to spare:
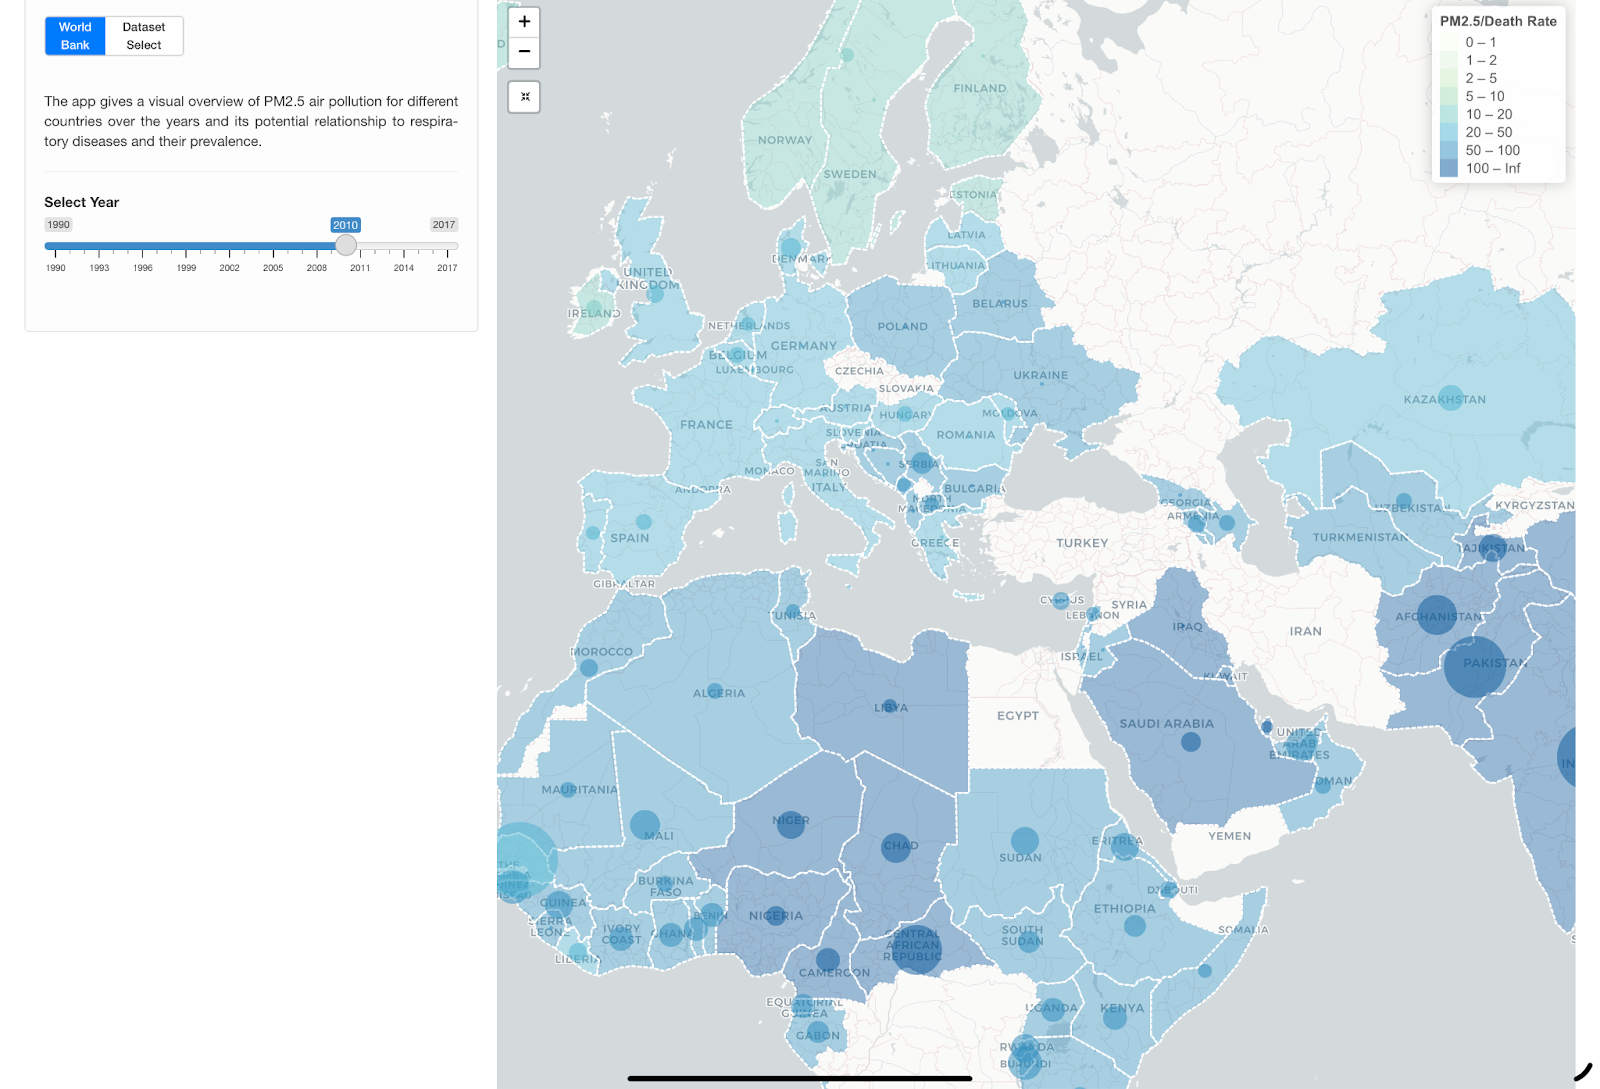
The Respiratory Diseases app gives a visual overview of PM2.5 air pollution for different countries over the years and its potential relationship to respiratory diseases and their prevalence:
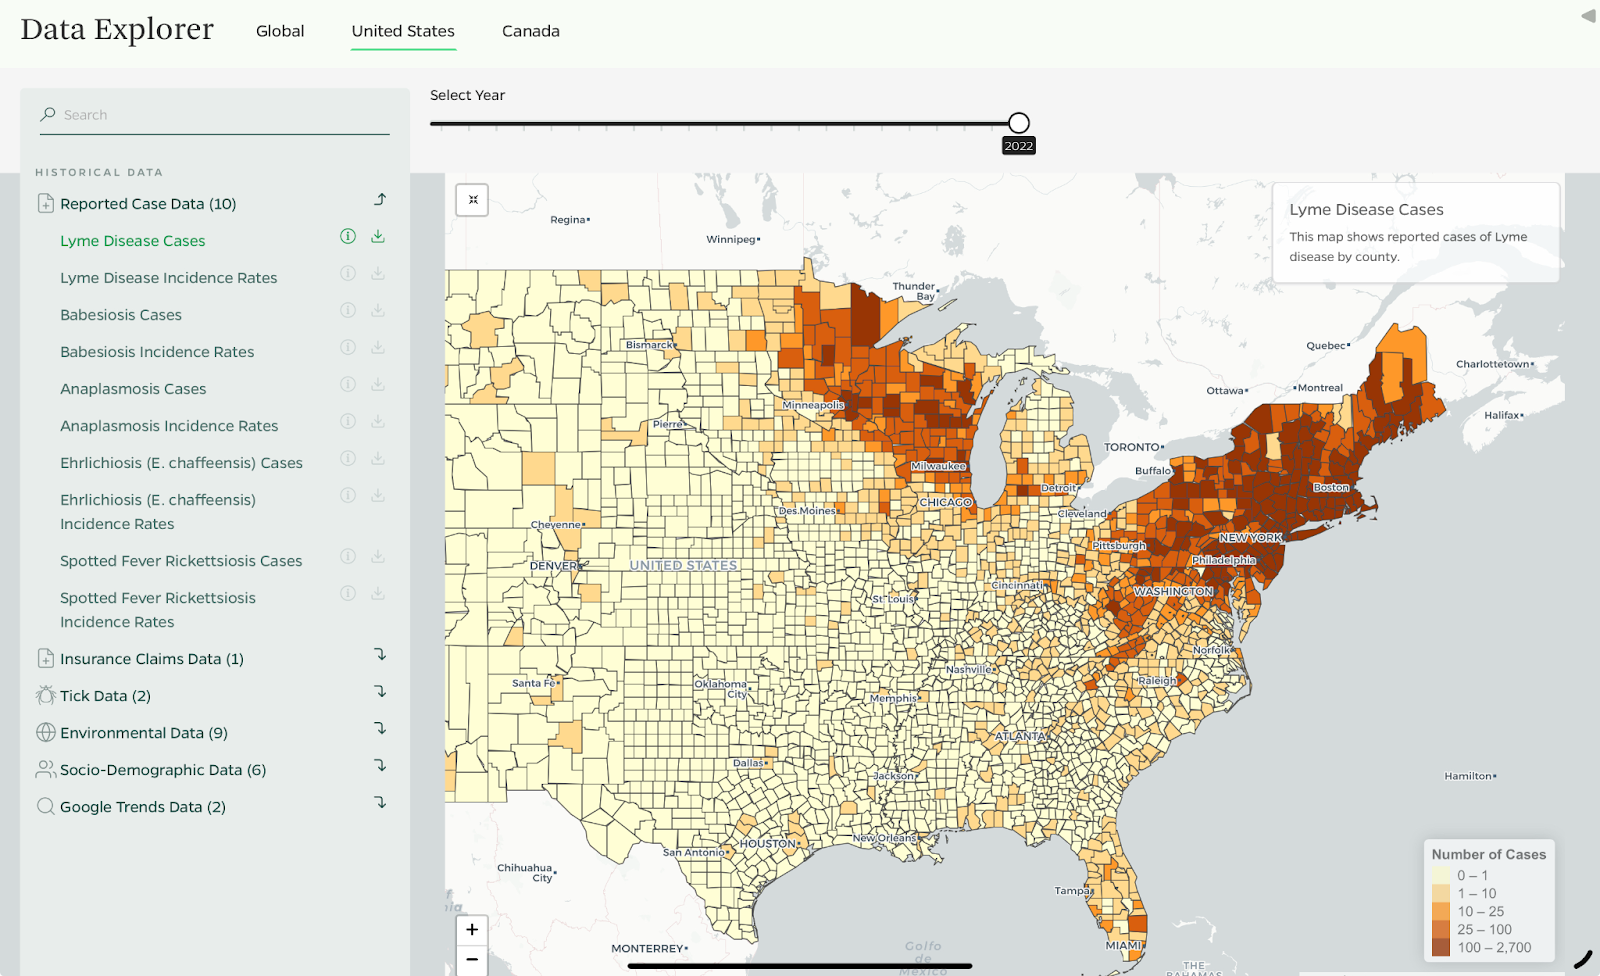
The Johns Hopkins Lyme Disease App shows various statistics on Lyme disease cases, insurance claims, environmental data, and much more, either globally or focused on the United States/Canada:
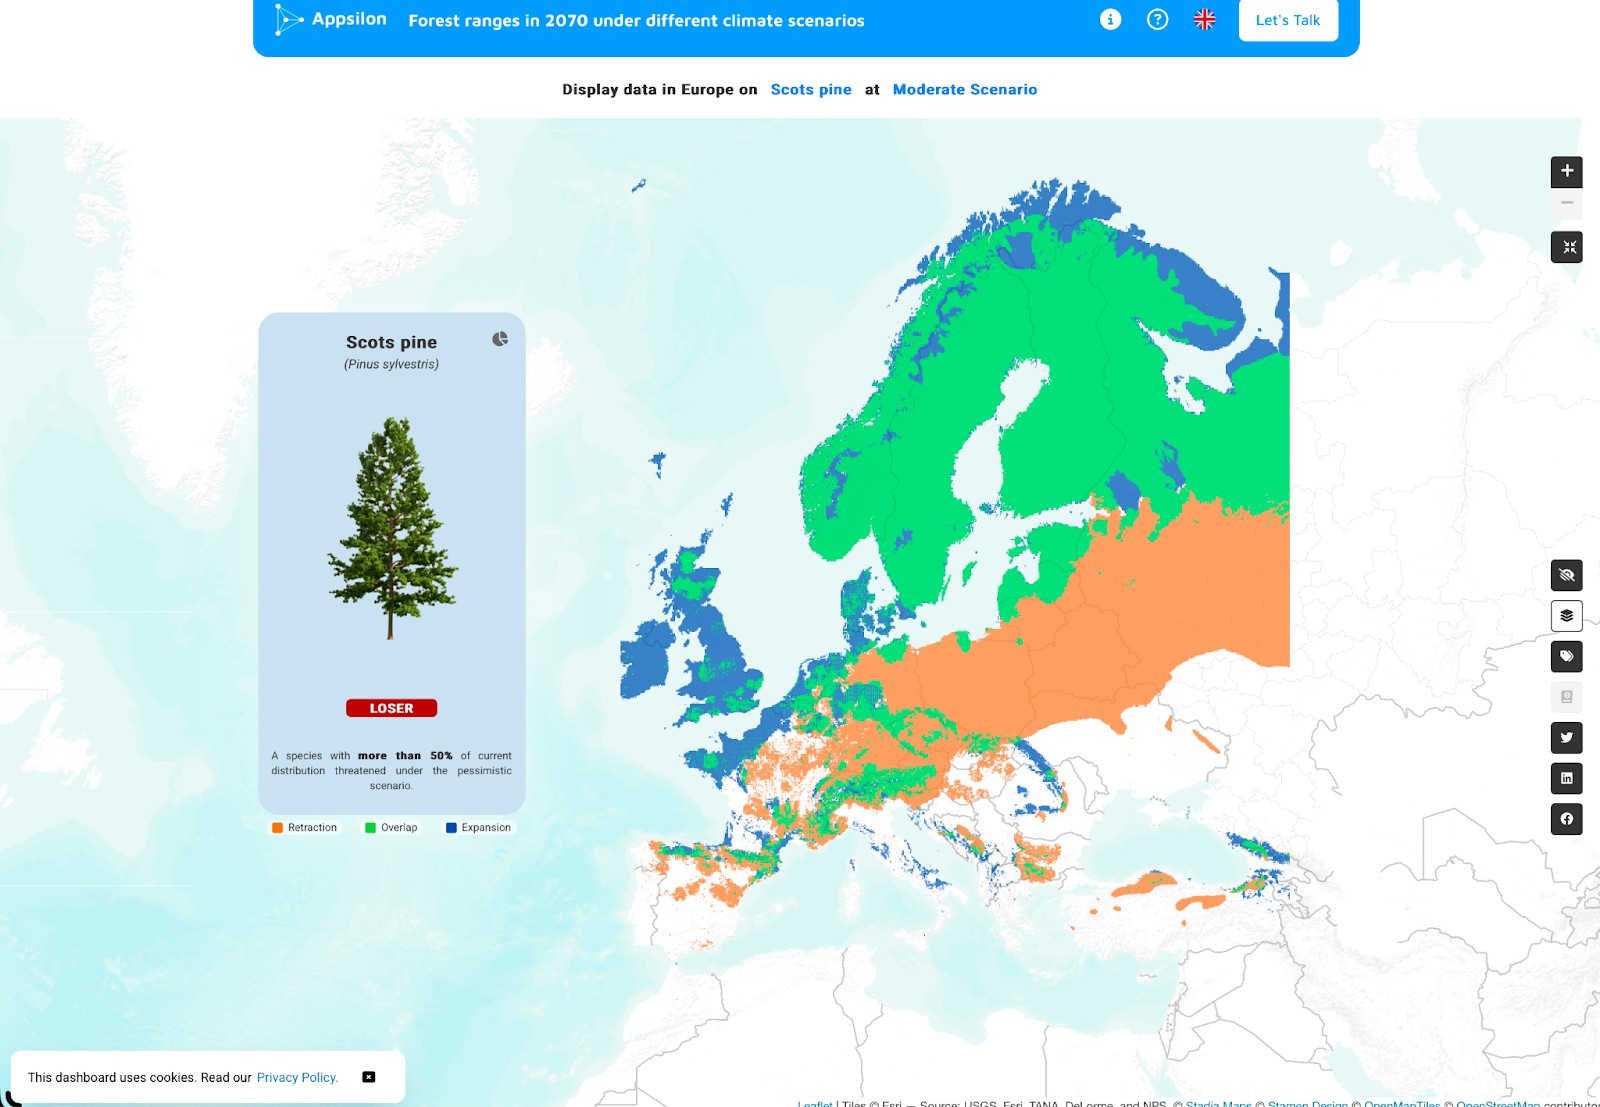
Our Future Forests application displays projections of different types of trees in Europe by the year 2070 through four scenarios: current, optimistic, moderate, and pessimistic:
Future of R Shiny
While no one knows exactly what the future holds, we can do our best to offer a couple of predictions for R Shiny in 2025 and beyond.
Keep in mind that these are just our estimates, gathered from years of developing R Shiny apps for Fortune 500 companies. We’re confident in our predictions, but markets and conditions change all the time, so bear that in mind.
R will remain the top choice for life sciences and pharma. While R didn’t make the cut in a list of top 10 programming languages for 2025, it’s still the most popular choice in industries such as life sciences and pharma. These industries are heavily research-based, and R is terrific for this task.
R will make strides in other industries, such as finance and healthcare. We see more and more R Shiny use cases and company adoption in industries such as finance, banking, manufacturing, and healthcare. That trend is likely to continue as more and more Fortune 500 companies see the value in R and Shiny.
R will be used more and more for regulatory submissions and compliance. The language is loved by many pharma and life science companies because it helps them streamline FDA/EMA submissions and stay compliant with GxP standards. If your company is interested in this area, our detailed guide will set you on the right track. We expect R to become even more vital for these tasks in the years to come.
R will remain the king of programming languages in bioinformatics. The Bioconductor package is a project that develops and shares open-source software for precise and repeatable analysis of biological data. Companies interested in bioinformatics and genomics see R as a must-know technology.
R and R Shiny will become more available. Recently, Shiny has expanded to Python, which makes it one of the most accessible frameworks for developing data science applications. There are no promises for the future, but maybe we’ll see it ported to other programming languages as well.
Additional Resources
This article is already jam-packed with valuable information and resources.
Still, there are a couple more we want to share. In this section, we’ll give you everything your team needs to get started, from official resources to our in-depth guide and workshops.
Shiny documentation
Our blog posts and tutorials
- R for Programmers - 7 Essential R Packages for Programmers
- How to Start a Career as an R Shiny Developer
- Basic Multipage Routing Tutorial for Shiny Apps: shiny.router
- Shiny Tutorial: Build a Full Shiny Dashboard with shiny.fluent
- Best Practices for Durable R Code
- How to Develop an R Shiny Dashboard In 10 Minutes or Less
- Top 3 Tools to Monitor User Adoption in R Shiny
- Rhino for Shiny Developers: Top 5 Must-Have Software Engineering Skills
- How to Generate Word Docs in Shiny with officer, flextable, and shinyglide
- shinytest2 vs Cypress: End-to-End (E2E) Testing in Shiny
- Shiny.gosling Examples and How to Run Them: Genomics Visualizations in R Shiny
R Shiny application examples
- R Shiny in Life Sciences - Top 7 Dashboard Examples
- R Shiny in Government - Top 7 Dashboards You Should See
- Redesigning Dashboards with Shiny and Rhino: World Bank's Carbon Pricing
- R Shiny Shipping Logistics: How Shiny Provides Value to Your Business
- R Shiny Examples in Pharma and Biotech
- Unveiling a New Era in Molecular Visualization: Introducing shiny.molstar for Large Molecular Structures Visualization in R
- Air Quality VS Respiratory Diseases Dashboard: Shiny as a Powerful Tool for Data-Driven Insights
Our workshops and webinars
- Video Tutorial: Build a Video Game in R Shiny with Appsilon's Pedro Silva
- Appsilon's Shiny Masterclass is Now Available
- shiny.fluent Video Tutorial: Building Beautiful Shiny Apps
- Enterprise Shiny Apps from Concept to Production: Appsilon & RStudio X-Session
- Shiny UI & UX With Short Live Coding Tutorial
Guides on transitioning to Shiny
- Power BI vs R Shiny: Two Popular Excel Alternatives Compared
- 3 Top Business Intelligence Tools Compared: Tableau, PowerBI, and Sisense
- Python Dash vs. R Shiny - Which To Choose in 2021 and Beyond
- Choosing the Right Data Visualization Tool: R Shiny, PowerBI or Spotfire
Guides on scaling Shiny
- Scaling and Infrastructure - Why is My Shiny App Slow?
- R Shiny Caching - Top 3 Ways to Cache Interactive Elements in R Shiny
- shiny.worker: Speed Up R Shiny Apps by Offloading Heavy Calculations
Guides for deploying Shiny
- How to Share R Shiny Apps - Top 3 Methods Explained
- R Shiny Deployment: 5 Options for Individuals and Enterprises
- ShinyProxy vs Posit Connect: Benchmark Test for Scaling Shiny Apps
- R Shiny Docker: How To Run Shiny Apps in a Docker Container
- Renv with Docker: How to Dockerize a Shiny Application with a Reproducible Environment
- Docker vs. Podman vs. Singularity: Which Containerization Platform is Best for R Shiny?
- Why You Should Use RStudio (Posit) Connect Authentication And How to Set It Up
- How to Build a Custom Login Page for RStudio (Posit) Connect
- R Shiny Security: How to Make Your Shiny Apps Secure
Wrapping Up
In the end, we hope you now have all the information needed to start adopting Shiny in your organization.
At Appsilon, we consider R Shiny to be a transformative technology for building dashboards and applications, especially in pharma, life sciences, and research-heavy fields. It’s a one-stop shop for combining R’s power for statistical analysis, data manipulation, and visualization into a package for real-time decision-making and support.
For pharma and life science organizations, Shiny is a superb tool that enables data-driven decision-making. Whether you need a clinical trial monitoring dashboard, an application for visualizing genomic data, or a way to analyze drug efficacy, Shiny can do it — especially when paired with enterprise-grade solutions like Rhino.
Today’s comprehensive guide demonstrated exactly how managers and directors should go about adopting R Shiny and highlighted key aspects their developer teams should focus on to mitigate pain points early on. You can send this article to your team, and with a little time, they’ll be able to provide real value to your organization.
If you encounter any roadblocks along the way, Appsilon is here to help.
We have a team of R Shiny experts who have built dozens of applications for Fortune 500 companies. They’ve proven themselves time and time again by solving highly specific problems in enterprise environments.
Schedule a discovery session with Appsilon to discuss your Shiny needs.