Shiny Dashboards that Drive Innovation and Impact
From raw data to actionable insights: a curated collection of custom dashboards for Fortune 500 companies and internal solutions built with Shiny for R, Python, React, and other technologies.


Streamline Manufacturing Process


Drug Flow Optimizer is an application our engineers built with our open-source Rhino package to help pharmaceutical manufacturers track the quality and performance of their manufactured batches of drugs.
It visualizes the entire manufacturing process for pharmaceutical ingredients, allowing end-users to identify whether a given batch falls within quality standards.
Explore Shiny
Dashboards in Action
Curious about what we can build? Browse interactive demos showcasing
Shiny-powered dashboards and applications.


Advancing FDA Clinical Trial Submissions with R
Together with the R Consortium's R Submissions Working Group, we have been working to improve practices for R-based clinical trial regulatory submissions. The goal is to provide open examples of submitting R-based clinical trial data and analysis packages to the FDA.
The first four pilots we developed focused on common analyses, Shiny application submission, and ADaM datasets. Pilot 4, which explores alternative formats, is currently under revision, and Pilot 5 has just been launched.


See What’s Underneath the UI
Explore success stories and projects we delivered for our clients. Learn more about technologies, frameworks, and tools we honed to deliver the best quality in a timely manner.

New Functionalities and UI for Health Equity Explorer
The collaboration with BMC led to significant improvements of the tool, integrating advanced data visualization, logistic regression models, sophisticated filtering features, and expansion of geospatial variables available.
How Climate Change Affects Forests


In collaboration with the Polish Academy of Sciences, our engineers built a R Shiny data visualization showcasing climate scenarios and their projected impact on European Forests.
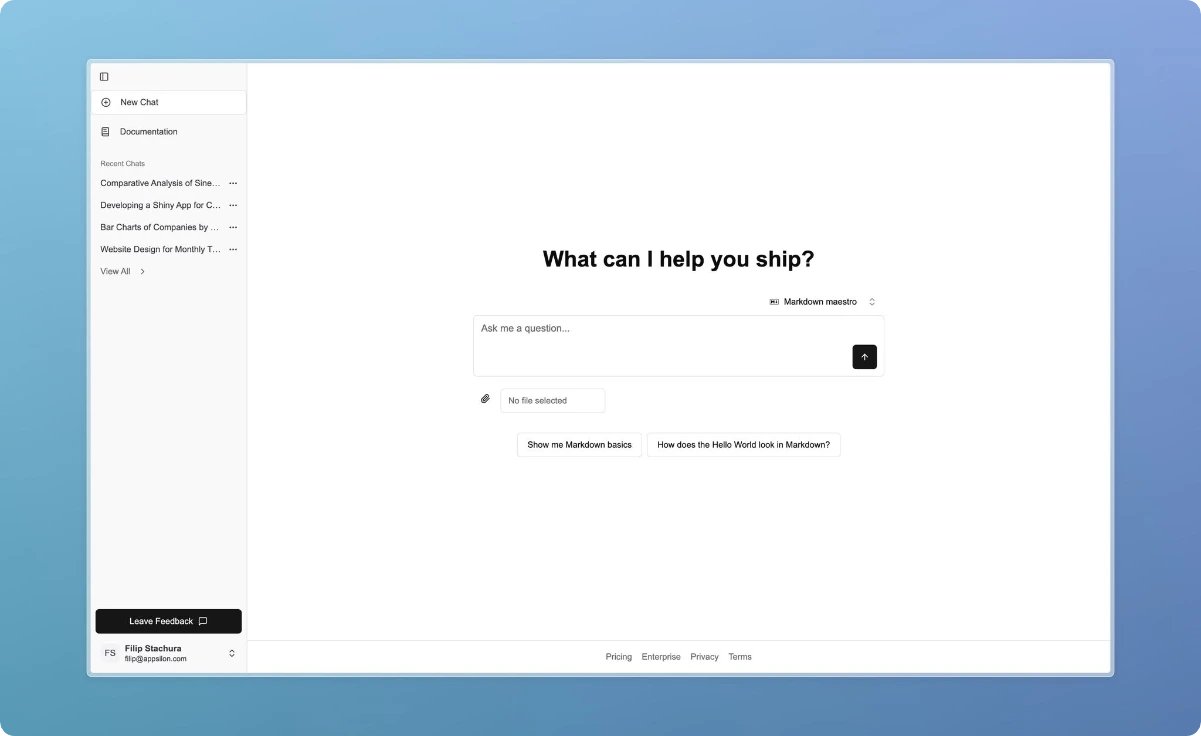
Build Dashboards Faster
with LLM
Imagine you can build a Shiny application using natural language and deploy it directly to Posit Connect or publish on GitHub. Flow is an assistant that translates your prompt into a custom dashboard. Contact us to schedule a demo.

Leverage Your Data for Insight
Appsilon empowers pharmaceutical and life sciences companies to leverage open-source technology for faster, data-driven decision-making in regulated environments.