About the Project
Boston Medical Center (BMC) is actively shaping the future of medicine by pioneering advanced treatments and therapies in addition to expanding what is considered medicine in order to address the root causes of health inequities. Recognizing the need to enhance the functionality and user interface of the Health Equity Explorer, a data-driven application aimed at addressing health disparities, they partnered with Appsilon.
This collaboration led to significant improvements of the tool, integrating advanced data visualization, logistic regression models, sophisticated filtering features, and expansion of geospatial variables available. The upgraded Health Equity Explorer now stands as a tool in advancing health equity research, embodying BMC's commitment to innovative and equitable healthcare solutions.
Background
Health outcomes are influenced by several factors beyond clinical care, such as socio-economic status, race, and disability, requiring the need for a comprehensive approach to understanding and addressing health inequities. The Health Equity Accelerator set up by BMC laid the groundwork for developing the Health Equity Explorer application.
This application integrates clinical data with social and environmental determinants of health (SDoH) to provide a holistic view of health and health equity.
Meeting BMC’s Needs:
In embarking on this transformative project, our mission was clear and multifaceted, guided by the core needs of our client: Technical Expertise and Performance. Here’s how we navigated the journey:
- Technical Expertise and Performance: The challenge was to leverage cutting-edge technology for rapid development and application performance, ensuring sensitive data remained secure.
- Cost and Accessibility: Tableau’s expensive licensing ($75 per user per month for Tableau Creator, $42 per user per month for Tableau Explorer, and $900 per user annually) and lack of extra customization proved prohibitive and would’ve hindered BMC’s partners. This led us to utilize R Shiny for its open-source, free access model, which enables us to democratize the use of the Health Equity Explorer, ensuring its accessibility to all BMC partners.
- User-Friendly Tool: We aimed to develop an open-source tool that simplifies exploring and visualizing health outcomes influenced by various determinants.
- Ease of Customization: Beyond cost, Tableau’s technical limitations also prompted our shift to R/Shiny, as we needed a platform that could seamlessly handle complex statistical functions and customizable analytics.
Methodology and Features:
- Utilization of the OMOP (Observational Medical Outcomes Partnership) Common Data Model [a standardized structure for organizing health data from different sources], integrating clinical, demographic, social, and environmental data.
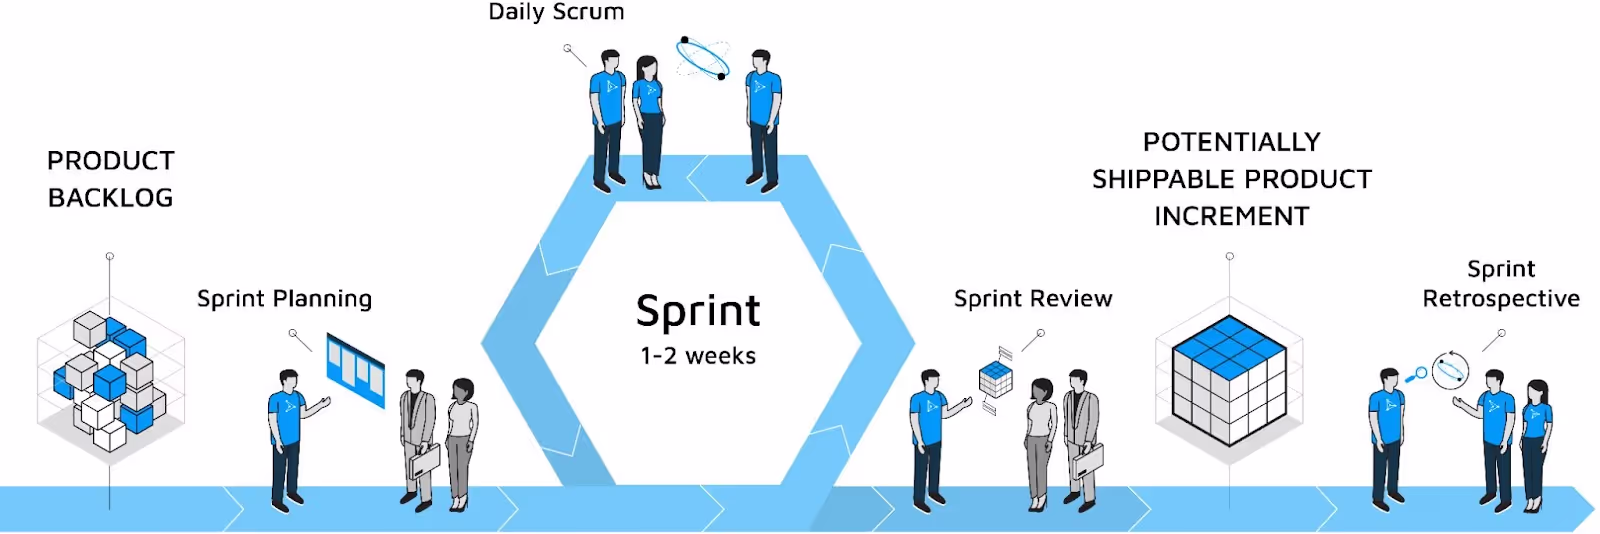
- Development of an R and Shiny-based application allowing for flexible, self-service exploration and analysis by a cross-functional team following the Scrum agile methodology, including a Delivery Manager, Technical Lead, Shiny Engineers, UI designers, and Infrastructure specialists.
- Features allowing for detailed examination of health outcomes, such as blood pressure control across different demographics and social determinants, through various data visualizations and statistical models.
Tech Stack:
- Database based on The OMOP (Observational Medical Outcomes Partnership) Common Data Model - integrating clinical, demographic, social and environmental data
- Shiny
- Rhino
- Shinyproxy
- Linux Servers
- Machine Learning Algorithms
- Geospatial Data for Maps
Results
- Application improvement (code refactoring, database optimization, Shinyproxy deployment and UI/UX that is both elegant and user-friendly).
- Improved functionally (Machine Learning Module, support for Zip5 and FIPS code-based data, sophisticated map visualizations, and expanded inventory of place-based variables for the United States.
- Improved capacity for researchers and healthcare professionals to identify and address health inequities.
- Setting up the groundwork for accessible and distributed health equity research and analytics.
The application incorporated machine learning algorithms to enhance patient analytics further; learn more about this next step in our case study.
The team was able to get up to speed with a very complex project quickly and make strategic and novel improvements. - Sarah Gasman, Senior Data Analyst at Boston Medical Center.